Curated OER
Graphing Linear Equations with Two Variables
Can your class solve linear equations in two variables? They will be able to after they engage in this lesson. Individuals graph linear equations in two variables using slope and intercept and identifying the relationship between the x...
Curated OER
Hyperbolas
Students engage in a lesson that covers the concepts related to the graphing of hyperbolas looking at topics like foci, center, vertices, and asymptotes. They find multiple different points in the coordinate plain and then plot the graph.
Curated OER
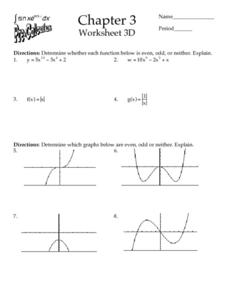
Chapter 3 - Worksheet 3D
In this pre-calculus worksheet 3D, students determine if a function is even or odd. They sketch graphs of functions and find the inverse of functions. This two-page worksheet contains 18 problems.
Curated OER
Sloping and Intersecting a Linear Function
Students examine and discuss typical linear equations, and the difference between a linear and nonlinear equation. They observe examples of linear equations and complete a worksheet.
Curated OER
Polar Graphs
Young scholars graph polar graphs. For this calculus lesson, students convert between polar and rectangular coordinates. They graph their solution on the TI calculator and make observations.
Curated OER
Slope of a Line
In this slope of a line activity, students read about line graphs and plotting the slope of a line. They read about the rate of change which is represented by the slope. Students practice finding the slope of lines.
Curated OER
Writing Equations from a Table
Students use coordinates in a table to write equations. For this algebra lesson, students discuss rate of change as it relates to slope and x and y values. They plot the points from a table to graph their lines and write an equation for...
Curated OER
Basic Algebra and Computers: Spreadsheets, Charts, and Simple Line Graphs
Students, while in the computer lab, assess how to use Microsoft Excel as a "graphing calculator." They view visual representations of line graphs in a Cartesian plane while incorporating basic skills for using Excel productively.
Curated OER
Graphing Linear Equations
In this calculator active graphing worksheet, learners graph 12 equations via a calculator and transfer the graphs onto coordinate grids.
Curated OER
2D Grpahing Functions
In this algebra worksheet, 9th graders graph linear equations using a line. They find values for x and y and plot them on a coordinate plane to make a line. There are 6 questions.
Math Mammoth
Slope; Math Mammoth.com
For this math activity, students find the slope of four lines when they are drawn on a coordinate grid. Students are given the slope and draw the line for two lines. They use the slope formula to find slope when given two points on a...
Curated OER
Solving Systems by Graphing
Learners solve systems of equation through graphing. In this algebra lesson, students solve linear equations and analyze the result to figure out if there is one solution, no solution or infinitely many solutions. They graph their lines...
Curated OER
Mine Shaft Grade 8 Slope
Eighth graders investigate slopes using real life scenario. For this algebra lesson, 8th graders model and interpret real life data. They plot their data in a coordinate plane and discuss the results with the class.
Curriculum Corner
8th Grade Math "I Can" Statement Posters
Clarify the Common Core standards for your eighth grade mathematicians with this series of classroom displays. By rewriting each standard as an achievable "I can" statement, these posters give students clear goals to work toward...
Mathematics Assessment Project
College and Career Readiness Mathematics Test C2
Scholars apply knowledge learned over their high school math courses in order to determine their college readiness. The 20-page resource emphasizes applied problem solving.
Curated OER
Investigating Correlation
High schoolers investigate different types of correlation in this statistics lesson. They identify positive, negative and no correlation as it relates to their data. They then find the line of best fit for the plotted data.
Curated OER
Properties of Logarithms
Students explore the concept of logarithms. In this logarithms lesson, students discuss the logarithm properties. Students use linear functions as a basis to develop the logarithm properites by substituting log b and log a for x and y.
Curated OER
Inequalities and Measures of Central Tendency
In this inequality and measures of central tendency worksheet, students solve and graph linear inequalities. They organize given data to identify the mean, mode and range. Students interpret box-and-whisker plots. This three-page...
Curated OER
Inverse Relations and Functions
For this algebra worksheets, students find the inverse of a given function by switching the y with the x. They graph the different functions and identify the difference. This worksheet includes thoughtful questions and worked examples.
Curated OER
Unit 5: Worksheet 4 - Proportions
In this proportion worksheet, students use proportions to find the missing side of similar triangles, they identify the percent of a number, and graph points on a coordinate plane. Students solve real life story problems dealing with...
Curated OER
Graph Paper
Students are given pre-made graph paper. In this algebra instructional activity, students are given copies of graph paper that can be used to plot points on a coordinate plane already measured out.
Curated OER
What Is Your Point?
Sixth graders identify the x and y axes in a coordinate plane and identifies the coordinates of a given point in the first quadrant. They plot specific points in the first quadrant of the Cartesian coordinate system.
Curated OER
Linear Equations Data Tables
Students graph linear equations on a Cartesian plane. After describing data tables and their use, students explore how the information from a table can be used to create a line graph. They discuss reasons for plotting a minimum of...
Curated OER
Graphing Linear Equations Using Data Tables
Students review the Cartesian plane and the process of plotting points. In groups, students create tables, identify the slope and y-intercept, and graph the equation. Afterward, students perform the same process, only, individually. As a...


