Curated OER
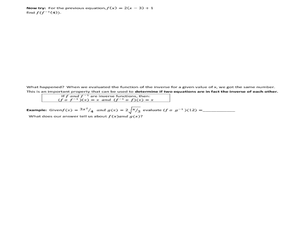
Inverse Relations and Functions
In this algebra worksheets, students find the inverse of a given function by switching the y with the x. They graph the different functions and identify the difference. This worksheet includes thoughtful questions and worked examples.
Curated OER
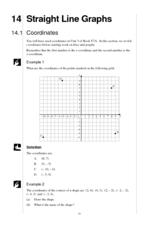
Straight Graph Lines: Coordinates
Students access prior knowledge of coordinates. In this coordinates lesson, students graph coordinate points to create a symmetrical figure and of a straight line. Students complete several practice examples.
Curated OER
Analyzing Graphs and Data
Students collect and analyze data. In this statistics lesson, students graph their data and make inferences from the collected data. They display their data using graphs, bar graphs, circles graphs and Venn diagrams.
Curated OER
The Relationship Between Slope and Perpendicular Lines
In this perpendicular lines worksheet, students explore the relationship between perpendicular lines and slope in eight exercises and two worked examples. The solutions are provided.
Curated OER
Slippery Slope
Students define patterns, relation and function. In this algebra lesson, students find the slope of a line and write equations of line. They model the slope using real life scenarios.
Curated OER
Calculating Distances in Two and Three Dimensions
Students use the Pythagorean Theorem to solve problems. In this geometry lesson, students solve for the distances by calculating the different parts of the shape of a two and three dimensional shape. They reason by analogy.
Curated OER
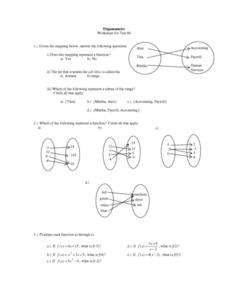
Trigonometry: Worksheet for Test #4
In this trigonometry activity, students determine whether given mappings are functions. They evaluate 5 functions for a given x value. Students graph 2 functions. They determine which ordered pairs are solutions to given functions....
Curated OER
Linear Regression on TI-89
For this linear regression worksheet, students use the TI-89 calculator to graph linear regressions. Details instructions on the use of the calculator are provided. This one-page worksheet contains six problems.
Curated OER
Histograms and Bar Graphs
Students are introduced to histograms, bar graphs, and the concept of class interval. They use an activity and three discussions with supplemental exercises to help students explore how data can be graphically represented (and...
Curated OER
Choosing a Summer Job
What did you do over your summer vacation. Young wage earners must compare summer job options, and determine when each job earn the same amount and what that amount be. This be done by creating, graphing, and solving systems of...
Curated OER
Scatter Graphs
In this scatter graphs worksheet, students learn a way of illustrating information about two related values. Students complete 30 questions about the graphs. Note: One of the graphs has English pounds. This is intended as an online...
Curated OER
Sets an the Venn Diagram
Students explore the characteristics of sets and Venn Diagrams. Given data, students practice determining the placement of elements in a Venn Diagram. Students discuss the correspondence between data sets and their graphical...
Curated OER
Price of Apples- Linear Data
Students collect data and create a graph. In this algebra lesson, students describe functions graphically, algebraically and verbally. They identify functions as being independent and dependent using variables.
Curated OER
Finding Area
Fourth graders explore how to find the area of a rectangular object. As a class, they discuss definition of area and strategies for finding area. The teacher models finding the area of an object by counting squares. Students observe...
Curated OER
Statistics: Misleading or Accurate?
Learners explore the concept of misleading statistics. In this misleading statistics lesson, students play a game of tag and graph the number of times each student gets tagged. Learners use the graph to determine the fastest runner in...
Curated OER
The Grand Excursion GPS Map
Eighth graders investigate the uses of a global positioning system. They create waypoints and have to find them using the system. Students must review the geographical concepts of latitude and longitude. The media requirements of the...
Curated OER
Linear Equations
In this algebra learning exercise, learners solve and graph linear equations. They differentiate between parallel and perpendicular lines. There are 35 questions about graphing.
Curated OER
"Homecoming" by Cynthia Voigt
Students use estimation skills to calculate distance traveled and then calculate walking rate traveled in MPH.
Curated OER
Sonar Mapping
Students use a shoe box to create a seafloor model and use cardboard for layering inside of the shoe box to simulate the ocean floor. They probe the ocean floor to simulate sonar echoes. Finally, students graph their data to get a...
Curated OER
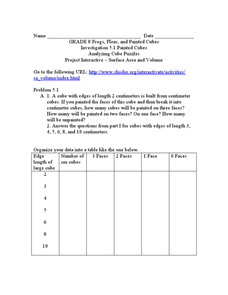
Analyzing Cubes
In this analyzing cubes worksheet, 9th graders solve and complete 6 different types of problems. First, they organize the given data into the table provided. Then, students study the patterns in the table and tell whether the pattern of...
Curated OER
Even More Calculus
In this calculus worksheet, 12th graders differentiate and integrate basic trigonometric functions, calculate rates of change, and integrate by substitution and by parts. The twenty-two page worksheet contains explanation of the...
Curated OER
Comparing Negative Fractions, Mixed Numbers and Decimal
Seventh graders explore the concept of negative rational numbers. In this negative rational numbers lesson, 7th graders discuss similarities between positive and negative rational numbers. Students predict what rational numbers lie...
Curated OER
Distance in Coordinate Geometry
Young scholars analyze distance and graphing. In this geometry lesson, students work problems on a coordinate grid calculating the distance. They apply the Pythagorean Theorem to their data and answer.
Curated OER
Finding Slope of a Line
Students calculate the slope of a line. In this algebra lesson plan, students graph a line using the slope and y-intercepts. They define the steepness of the line using the slope.
