University of Regina (Canada)
University of Regina: Math Central: Graphing Activities
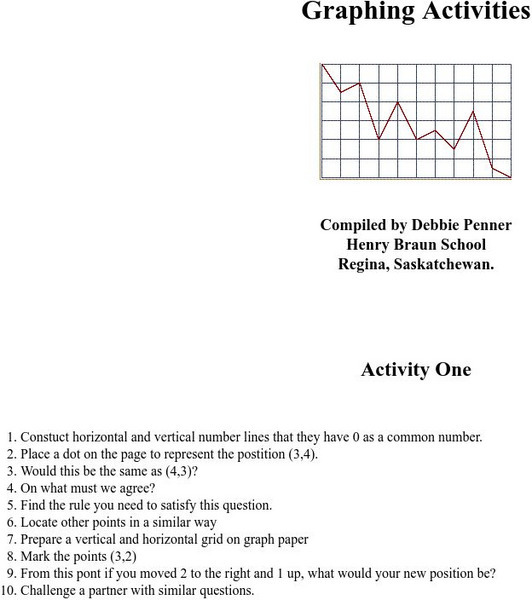
Eighteen different graphing activities will teach students how to plot points, draw lines, compare graphs, and problem solve.
University of Regina (Canada)
University of Regina: Math Central: Graphing Activities
Eighteen different graphing activities will teach students how to plot points, draw lines, compare graphs, and problem solve.
Khan Academy
Khan Academy: Scatterplots and Correlation Review
A scatterplot is a type of data display that shows the relationship between two numerical variables. Each member of the dataset gets plotted as a point whose x-y coordinates relates to its values for the two variables.
Other popular searches
- Plotting Coordinates Picture
- Plotting Points Pictures
- Fun Plotting Points
- Plotting Points on Graphs
- Plotting Coordinates Maps
- Plotting Coordinates on Maps
- Plotting Points on a Graph
- Plotting Coordinates Graphs
- Plotting Points on a Grid
- Plotting Points Math
- Ell Math Plotting Points


