Curated OER
Quick Graphs of Linear Equations
Graph equations of lines using the slope-intercept method or by plotting both x and y intercepts. Determine if two lines are parallel or perpendicular by comparing their slopes. This handout includes step-by-step directions and four...
Curated OER
Exploring Quadratic Data with Transformation Graphing
Using a data collection device to collect data regarding a bouncing ball, learners use various features on graphing calculators to experiment with the parameters of the vertex form of the parabola and their effect on the shape of the...
Curated OER
Lines, Lines, Everywhere
Students explore linear equation suing real life scenarios. In this algebra instructional activity, students find the slope and intercept of a line. They create table of values to plot their graph and draw conclusions.
Curated OER
Algebra 1 Worksheet
In this algebra worksheet, learners solve equations for y, graph the equations using the slope and y-intercept, and name four points on the line. There are 20 questions with their graphs.
Curated OER
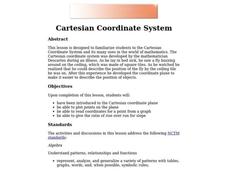
Cartesian Coordinate System
Students explore the Cartesian coordinate plane and plot points on the graph. They interpret coordinates for a point from the graph and give the ratio of rise over run for slope.
Curated OER
Generating Points and Graphing
Students create a table of values to help them plot. In this algebra lesson, students plot their points on a coordinate plane creating a graph. They observe and analyze linear functions.
Curated OER
Graph Paper
Students are given pre-made graph paper. In this algebra lesson, students are given copies of graph paper that can be used to plot points on a coordinate plane already measured out.
Concord Consortium
Function Project
What if a coordinate plane becomes a slope-intercept plane? What does the graph of a linear function look like? Learners explore these questions by graphing the y-intercept of a linear equation as a function of its slope. The result is a...
Shodor Education Foundation
Data Flyer
Fit functions to data by using an interactive app. Individuals plot a scatter plot and then fit lines of best fit and regression curves to the data. The use of an app gives learners the opportunity to try out different functions to see...
Curated OER
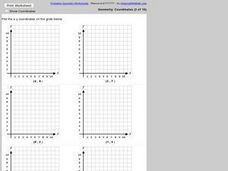
Plotting Coordinates on a Grid
In this plotting points on a graph worksheet, middle schoolers plot 6 points on 6 graphs. Students plot x and y-coordinates in the first quadrant.
Curated OER
Graphing and the Coordinate Plane
Students gain practice reading coordinates and plotting points by participating in the Coordinates! Game. They demonstrate and test their skills with graph paper and the Maze Game.
Alabama Learning Exchange
We Love to Graph!
Students experience graphing points. For this graphing points lesson, students play an on-line game where they must name 10 coordinate pairs correctly. Students play a maze game where they maneuver a robot using coordinate pairs. ...
Curated OER
Reading Graphs
Students plot functions on the Cartesian coordinate plane. They explore lines and parabolas. Students analyze graphs and answer questions about the information presented on the graph using an online program.
Curated OER
Linear Graphs and Equations
In this linear graphs and equations learning exercise, students examine points on a graph and identify coordinates plotted on the point. Students determine the slope of a line and write the equation of a line. This three-page learning...
Curated OER
Using Graphs
For this using graphs worksheet, 9th graders solve and complete 6 different types of problems. First, they determine how the transformation shown moves the graph. Then, students find the interval that is defined given the coordinates....
Curated OER
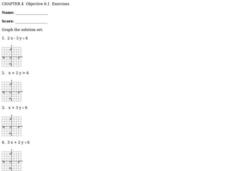
Graphing Inequalities
In this graphing inequalities worksheet, students solve and graph the solution set for eight inequalities. They first solve each inequality, either for x or for y, then they plot the coordinates found on the graph provided for each...
Curated OER
Graphing Linear Equations with Calculator
Students graph lines using the calculator. In this algebra instructional activity, students graph lines of equations in the form y=mx+b. They input equations into the TI Calculator and graph using the slope and intercept. They analyze...
Curated OER
Graphing Linear Equations
Ninth graders review the information that they have already learned
with regard to linear equations and graphical representations. They then assist in combining equations with a graphical element and complete various graphs with this...
Raytheon
Graphing: Slope
For this slope instructional activity, students complete problems having to do with slope including adding integers, graphing, finding ordered pairs, and more. Students complete 55 problems.
Curated OER
More graphing situations by making a table
Students make a table and graph plotting points. In this algebra lesson, students graph linear equations on a coordinate plane. They calculate the rate of change and analyze the graph for extrapolation.
Curated OER
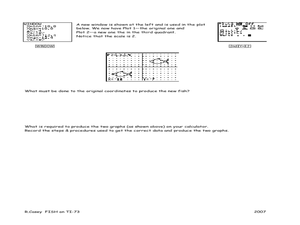
Fishing for Points
Learners explore the concept of ordered pairs. In this ordered pairs lesson, pupils list the ordered pairs of a graph in the shape of a fish. They use their calculator to translate the fish using lists, then translate the fish left,...
Curated OER
Perplexing Puzzles
Elementary and middle schoolers explore scatter plots. In this graphing lesson, pupils work in small groups and use jigsaw puzzles to develop a scatter plot. Younger students may develop a bar graph.
Curated OER
Graphs: Scatter Graph
In this scatter graph activity, students read and interpret given scatter graphs. They plot ordered pairs and write numbers from least to greatest. This fourteen activity contains approximately 18 problems. Some answers are provided on...
Curated OER
Straight Line Graphs
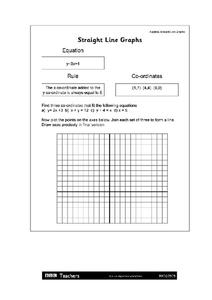
In this straight line graph worksheet, students identify linear equations. They plot points of given problems. This one-page worksheet contains 3 problems.


