Curated OER
Mobile vs. Money
Learners research the internet and use the information they find to plot straight line graphs. They use graphs to make comparisons of the various packages offered. Students interpret graphs and solve problems based on varying parameters.
Curated OER
Coordinate Graphs
Learners use coordinate graphs in order to identify objects and their locations. They are shown how to plot the x and y coordinates and then are given values to be plotted during guided and independent practice. Students are assessed on...
Curated OER
Graphing Functions With 2 Points and From a Graph
Young scholars plot points on a coordinate plane. They describe, in words, methods for finding the slope of a line. After given a worksheet, students read instructions, draw a Cartesian plane, plot ordered pairs, and graph lines. ...
Curated OER
Graphing Linear Functions - Review
Pupils graph linear functions. They plot three points, create a line, and discuss methods to find the slope of line. In groups, students solve problems, graph their lines and find the slope of a line using various methods. Upon...
Curated OER
Little Red Corvette
Students investigate the acceleration of a car. In this acceleration of a car lesson, students make a scatter plot of corvette acceleration data. Students find a model to fit the data by taking the integral of the curve created by the...
Curated OER
Histograms and Statistical Graphics
In this statistics worksheet, students solve 6 data problems. They construct a histogram of given data, they create a frequency polygon, and a stem and leaf diagram. Students create a dot plot and a pie chart for given data sets. On the...
Curated OER
"M&M's"® Candies Worksheet 2
In this math worksheet, learners plot the mean, median, and mode for the colors of M and M candies by filling in the graphic organizer.
Curated OER
Making an Alien Mask Using Coordinate Pairs
In this math activity, students create an alien mask and practice graphing coordinate pairs. Students follow the directions to plot coordinates on an x and y axis. When they are finished students will see an alien face which can be made...
Curated OER
Grids and Coordinates
In this grids worksheet, students learn about grids, or coordinate plants, axes, coordinates, plotting and ordered pairs. They then complete the 5 questions using what they learned. The answers are on the last page.
Curated OER
Graph Activity
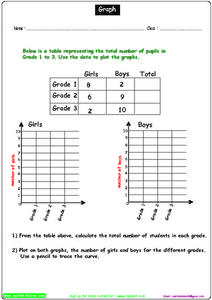
In this graphing learning exercise, students complete a data table, then use the data to draw a set of 2 graphs, calculate totals and plot numbers on both graphs.
Curated OER
Cumulative Frequency
In these word frequency worksheets, students choose a page from a newspaper and count the number of letters in each word and complete their results in a table. Students then calculate the mean number of letters. Students then collect...
Curated OER
Prime Factorization, Equivalent Fractions and GCF review
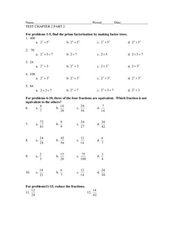
In this sample test worksheet, students solve twenty-five problems covering prime factorization, equivalent fractions, greatest common factor, and plotting on a number line. Solutions are provided.
Curated OER
Types of Graphs
Fifth graders construct graphs. In this graphing lesson, 5th graders learn about various types of graphs such as bar, line, circle, picture and stem and leaf plot. Students work in groups to create examples of each graph.
Curated OER
Looking Normal
Students identify the shape of a function. In this statistics lesson, students plot the data collected. They analyze their data for positive, negative or no correlation. They find the line of best fit.
Curated OER
Black Out
Pupils collect and analyze data. In this statistics lesson plan, students plot their data on a coordinate plane and find the line of best fit. They calculate the linear regression using the data.
Curated OER
Building a Rover
Middle schoolers investigate properties of lines and points by making a rover. In this algebra lesson, students plot points correctly on a coordinate plane. They identify coordinate pairs given the plots and lines.
Curated OER
Graphing and the Coordinate Plane
Students learn about the Cartesian coordinate plane, understand the four quadrants of the Cartesian coordinate plane, and plot points on the plane. Students read coordinates for a point from a graph and give the ratio of rise over run...
Curated OER
Match My Masterpiece
Fifth graders plot out points on grid paper which correspond with the ordered pairs they are given. If done correctly, the points form a word.
Curated OER
The Coordinate Plane
Fifth graders use the attached worksheet, Where's My Location? - Directions, to play a game in which they plot points on a grid.
Curated OER
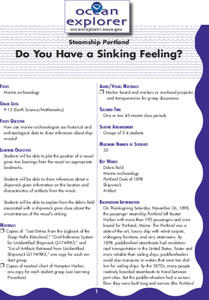
Do You Have A Sinking Feeling?
Students plot the positions of vessels given bearings in the form of landmarks. They explain how the debris field can help solve the mystery in how the ship sunk.
Curated OER
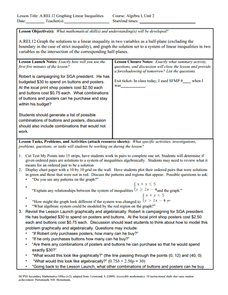
Graphing Linear Inequalities
Eighth graders extend skills for representing and solving linear equations to linear inequalities. Lesson activities build understanding and skill by plotting ordered pairs of numbers that either satisfy or do not satisfy a given...
Curated OER
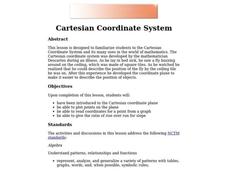
Cartesian Coordinate System
Students explore the Cartesian coordinate plane and plot points on the graph. They interpret coordinates for a point from the graph and give the ratio of rise over run for slope.
Curated OER
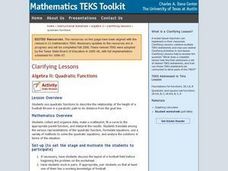
Algebra II: Quadratic Functions
High schoolers collect and organize data, make a scatterplot, fit a curve to the appropriate parent function, and interpret the results. Students translate among the various representations of the quadratic function, formulate equations,...
Curated OER
Using Coordinate Geometry by Land, Sea and Outer Space.
Young scholars complete a table of values and plot points, as well as construct a graph on a coordinate grid. They construct two graphs on the same coordinate system, and identify the point of intersection. Students represent and record...
Other popular searches
- Line Plots
- Scatter Plots
- Stem and Leaf Plots
- Box and Whisker Plots
- Box Plots
- Frequency Tables Line Plots
- Scatterplot
- Dot Plots
- Math Scatter Plots
- Line Plots Grade 3
- Stem and Leaf Plots
- Box Whisker Plots


