Curated OER
Whose Breakfast isn't for the Birds?
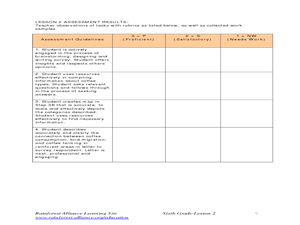
Students explore coffee production. In this cross-curriculum rainforest ecology lesson, students research regions where coffee comes from and investigate how the native birds in the rainforest are effected by coffee production. ...
Curated OER
Geography of the Harbor
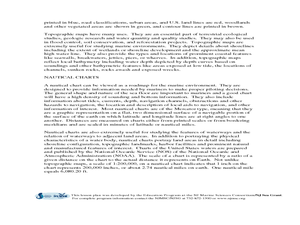
Students study estuaries and their boundaries. In this investigative lesson students locate an estuary on a map and use nautical and topographical maps.
Curated OER
Business Lesson Describing Trends
Students practice their skills using business English. After a lecture/demo, students interpret economic graphs which are imbedded in this instructional activity. Then, they create their own graphs and describe them to the class.
Curated OER
Magnetism and the Magnetic Force
Fourth graders investigate magnetism and the magnetic force.
Curated OER
Technology vs. Nontechnology
Fourth graders determine the range, mean, median and mode using a computer spreadsheet. An identical set of calculations is done without using a computer. The results of each method are compared. They calculate the mode, median and range...
Curated OER
Creating Graphs from Tables
Students interpret data from tables and then create a graph to show the same data in a different organization.
Curated OER
Exercise Those Statistics!
Students participate in various activities, measuring their pulse rates and recording the data. They analyze the statistical concepts of mean, median, mode, and histograms using the data from the cardiovascular activities.
Curated OER
The Proof Is in the Picture
Students select a geometric figure and find an example of the figure in their surroundings. They photograph the figure and write a proof to accompany it. They match photos to proofs.
Curated OER
Connecting Characters and Themes in Julius Caesar
Fourth graders prepare for the literary analysis. They locate, interpret, evaluate and analyze the relationship between a character and the theme. After a lecture/demo, 4th graders write topic and detail sentences, then correctly put...
Curated OER
A Whale of a Tale
Students read "A Very Hungry Caterpillar" and discuss factual information in the book. They research whales and use information to write a narrative story. They take their stories through the writing process.
Curated OER
How Safe Is Your Backyard?
Seventh graders investigate the safety of soil and water locally and communicate via the Internet with students in different locales sharing information. They research the Internet using its multimedia capabilities and collate the data...
Curated OER
Graphs Galore
Fourth graders conduct surveys to collect data. They analyze and interpret the data, then determine which type of graph is appropriate for the data. Students use the data to make predictions, discover patterns and draw conclusions...
Curated OER
Take Me Out To the Ball Game
Students use a map to graph and locate major league teams of different sports. In groups, they analyze the population data of the United States and compare it with the amount and location of the major league teams. They share their...
Curated OER
Most Wanted Villians
Young scholars review the characteristics of various characters in fairytales. As a class, they review the story details and create a concept map using a software program. They create their own wanted poster of the villians in the...
Curated OER
A Statistical Look at Jewish History
Students complete their examination over the Jewish Diaspora. Using population figures, they discover the importance of percentages in exploring trends. They use their own ethnic group and determine how it is represented in the United...
Curated OER
Around the World
Students explore ways people from around the world are like them. They discuss how geography affects the way people live and work and how culture affects a person's day to day life. Students give a presentation over a chosen country to...
Curated OER
How Does a Seed Grow Into a Plant?
Second graders explore how seeds grow into plants. They discuss types of seeds and place seeds in wet paper towels to germinate. They draw a picture in their journal to record their observations for four days. They take pictures of their...
Curated OER
Color Me Hot
Seventh graders use the scientific method, to observe, record and analyze the data they gathered. They make observations using their five senses. Students compare, contrast and draw conclusions based on the observations and data...
Curated OER
The Environment and Interactions of Living Organisms
Students study the environment and interactions of living organisms. They identify abiotic and biotic factors and create a foldable and vocabulary cards. They create a poster illustrating soil and watch a video to study symbiosis.
Curated OER
Comparison of Snow Cover on Different Continents
Students use the Live Access Server (LAS) to form maps and a numerical text file of snow cover for each continent on a particular date. They analyze the data for each map and corresponding text file to determine an estimate of snow cover...
Curated OER
Life Expectancy at Birth
Learners create a line graph on the life expectancy for males and females in Canada. In this math and health lesson plan, students review table and graph terminology, create line graphs, and analyze the differences in life expectancy...
Curated OER
A Bird's Eye View of our 50 States
Third graders focus on state birds as they learned absolute location (latitude/longitude) of each state, as well as their relative location (bordering states).
Curated OER
You Are What You Eat (High School)
Learners evaluate data from a statistical chart or graph which they find in a newspaper or magazine.
Curated OER
Graph Made Easy-Pre Test Questions
In this graphing pre test worksheet, students complete a set of 10 multiple choice questions. Page is labeled as a pretest, an answer link is provided.
Other popular searches
- Literature Plot Charts
- Liter Art Plot Charts
- Plot Charts for Reading
- Plot Charts for Literature
- Literart Plot Charts
- Literary Plot Charts
- Plot Charts Christmas


