Cuemath
Cuemath: Dot Plot
A comprehensive guide for learning all about dot plots with definitions, how to construct them, solved examples, and practice questions.
Cuemath
Cuemath: Scatter Plot
A comprehensive guide for learning all about scatter plots with definitions, how to construct and solve them, types of scatter plots, solved examples, and practice questions.
Shodor Education Foundation
Shodor Interactivate: Interactive: Scatter Plot
Use this interactive applet to input a series of (x, y) ordered pairs and plot them. Parameters such as minimum and maximum value, minimum and maximum y value, and x- and y-scale can be set by the user or determined by the applet.
Shodor Education Foundation
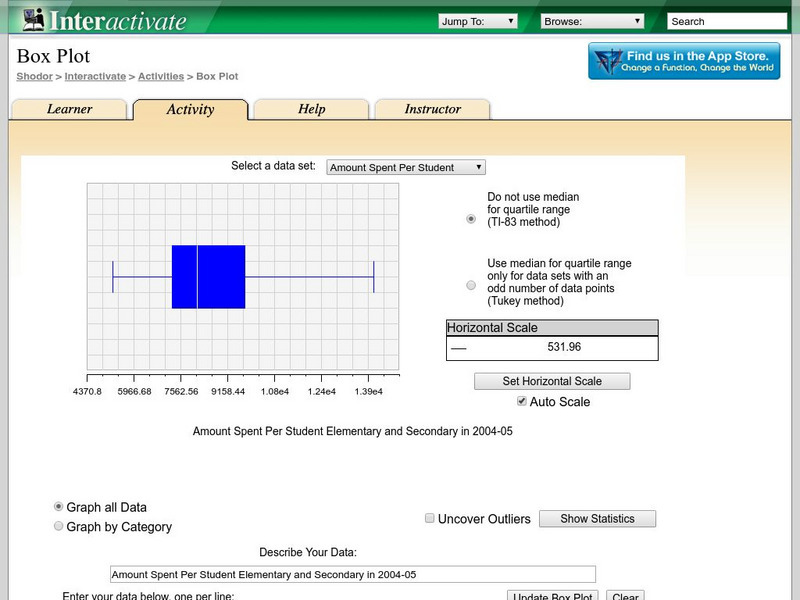
Shodor Interactivate: Box Plot
Students learn about box-and-whisker plots. The interactive box plot allows the user to explore maximum, minimum, median, upper quartile, lower quartile, and outliers.
Writing Fix
Writing Fix: Showing Plots & Conflicts
In this lesson plan, recommendations from Ralph Fletcher's book called Live Writing will be used as a teacher reference. Students will write introductions to three different stories in their writer's notebooks, but each type of conflict...
Purple Math
Purplemath: Stem and Leaf Plots
Explains how to create a stem-and-leaf plot from a data set. Demonstrates how to format a clear stem-and-leaf plot.
University of Illinois
University of Illinois: Scatter Plots and Correlations
This site gives information on scatter plots, along with examples showing high positive correlation, low negative correlation, high negative correlation, no correlation, and low positive correlation.
University of Victoria (Canada)
The U Vic Writer's Guide: Literary Term: Plot
This page offers a detailed overview of plot, including its various aspects and use in various types of literary works.
Shodor Education Foundation
Shodor Interactivate: Box Plot
Students can create box plots for either built-in or user-specified data as well as experiment with outliers. User may choose to use or not use the median for calculation of interquartile range.
Utah Education Network
Uen: Trb 3:2 Investigation 4 Plot Studies
Use a plot map to study the plants and animals living in a small area of their environment.
Shodor Education Foundation
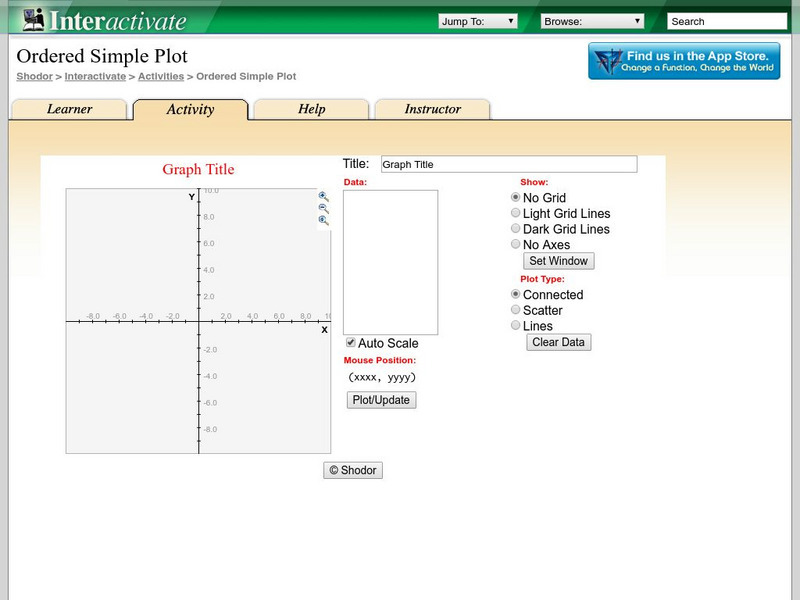
Shodor Interactivate: Ordered Simple Plot
The interactive learning activity allows students to plot multiple ordered pairs. Teacher resources are included.
ReadWriteThink
Read Write Think: Writing Alternative Plots for Robert O'brien's Z for Zachariah
Lesson in which students are required to write an alternative plot to O'Brien's science fiction novel. Includes an interactive graphic organizer, handouts, and a rubric.
Annenberg Foundation
Annenberg Learner: Organizing Data in a Stem and Leaf Plot
A stem and leaf plot is a graphical representation for investigating variation. You will convert an ordered stem and leaf display grouped by tens into an ordered display grouped by fives.
CK-12 Foundation
Ck 12: Statistics: Stem and Leaf Plots and Histograms
[Free Registration/Login may be required to access all resource tools.] Make and interpret stem-and-leaf plots and histograms for a set of data.
ReadWriteThink
Read Write Think: Circular Plot: Prediction Strategies in Reading and Writing
Contains plans for two lessons about circular stories like those of Laura Joffe Numeroff, who is known for the book "If You Give a Mouse a Cookie." Students read stories with circular plots as models before composing their own. In...
ReadWriteThink
Read Write Think: Graphing Plot and Character in a Novel
Contains plans for four lessons that use the book "The Watsons Go To Birmingham 1963" by Christopher Paul Curtis to teach about plot by asking student to graph events in the story. In addition to objectives and standards, this...
Better Lesson
Better Lesson: Plotting Climate Data
Third graders use climate data to create a key, plot data points, and interpolate data.
Better Lesson
Better Lesson: Places Everyone. Analyzing and Creating Stem and Leaf Plots
The students will be using discovery techniques to learn about stem and leaf plots.
ReadWriteThink
Read Write Think: Plot Structure: A Literary Elements Mini Lesson
Contains plans for two lessons that ask students to apply Freytag's Pyramid (also known as Freytag's Triangle) to pieces of writing, oral storytelling, and television shows. In addition to objectives and standards, this instructional...
National Council of Teachers of Mathematics
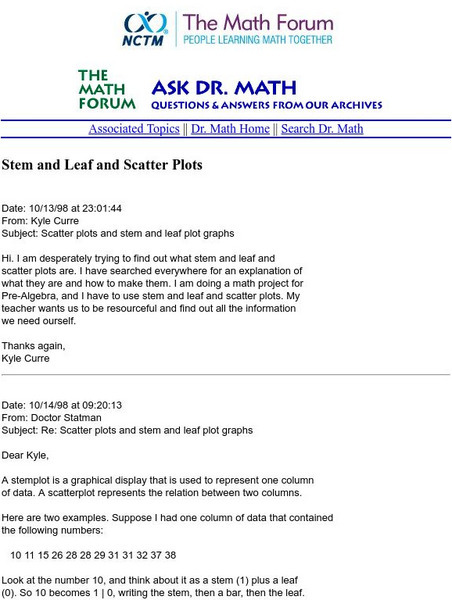
The Math Forum: Nctm: Ask Dr. Math: Stem and Leaf and Scatter Plots
This site is a question/response page which focuses on stem-and-leaf representation and how to construct scatter plots. Dr. Math works through an example and gives commentary notes. Site also contains links for more help.
Texas Instruments
Texas Instruments: Birthday Scatter Plot
Students will be able to interpret a scatter plot to see if there is a relationship between the two variables.
Scholastic
Scholastic: Cultivating Data
Students will understand key concepts of data analysis and their graphic representations. Students will construct and interpret data tables, line plots, box-and-whisker plots and stem-and-leaf plots, scatterplots with line of best fit,...
Other
Stem and Leaf Plotting
A nice explanation of a stem and leaf plot, accompanied by many helpful examples.
CK-12 Foundation
Ck 12: Plot Polar Coordinates
[Free Registration/Login may be required to access all resource tools.] Here you will learn how to convert and graph complex numbers in trigonometric or polar form using the polar coordinate system, which is similar in some ways to (x,...
Other popular searches
- Line Plots
- Plot Diagram
- Scatter Plots
- Line Plot Worksheets
- Stem and Leaf Plots
- Plot Structure
- Plotting Points on Graph
- Story Plot Diagram
- Elements of Plot
- Plot Development
- Box and Whisker Plots


