Hi, what do you want to do?
National Center for Ecological Analysis and Synthesis, University of California Santa Barbara
Ucsb / Pie Graphs (Piece of Cake)
This page gives an example and easy-to-understand description of a pie graph (circle graph.) Also provides an opportunity for students to test their abilities to read a pie graph.
Education Development Center
Tune in to Learning: Reading Charts and Graphs
Practice graph reading skills with these exercises and companion tutorials.
CK-12 Foundation
Ck 12: Statistics: Pie Charts Grade 6
[Free Registration/Login may be required to access all resource tools.] Interpret circle graphs and make predictions based on the displayed data.
Primary Resources
Primary Resources: Line Graphs and Pie Charts
Here are a few resources to use with your students when teaching about line graphs or pie charts.
Math Is Fun
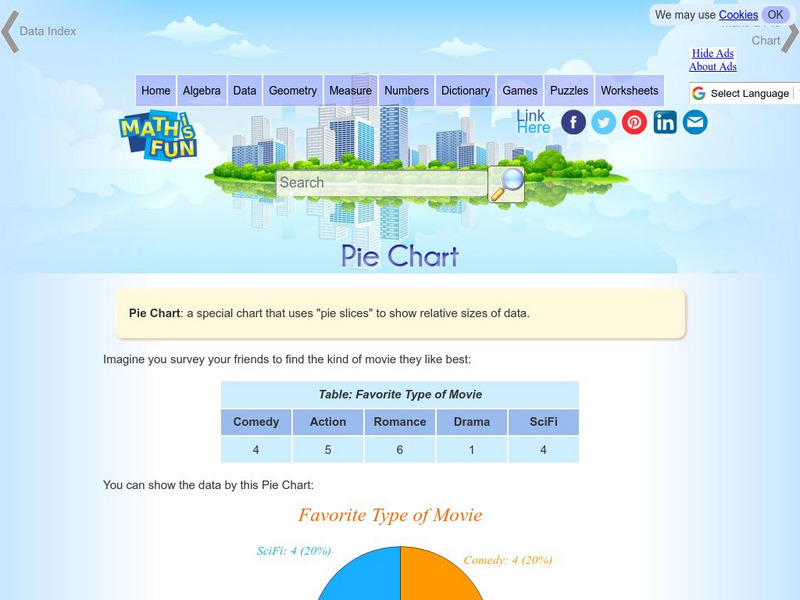
Math Is Fun: Pie Chart
Explains, with examples, what a pie chart is and how to make one. Includes a set of practice questions.
E-learning for Kids
E Learning for Kids: Math: Group of Pyramids: Fractions and Graphs
On this interactive website, students practice various math skills using a real-life scenario at the pyramids. Those skills include showing percentages as fractions and decimals and interpreting data in a sector graph.
National Center for Ecological Analysis and Synthesis, University of California Santa Barbara
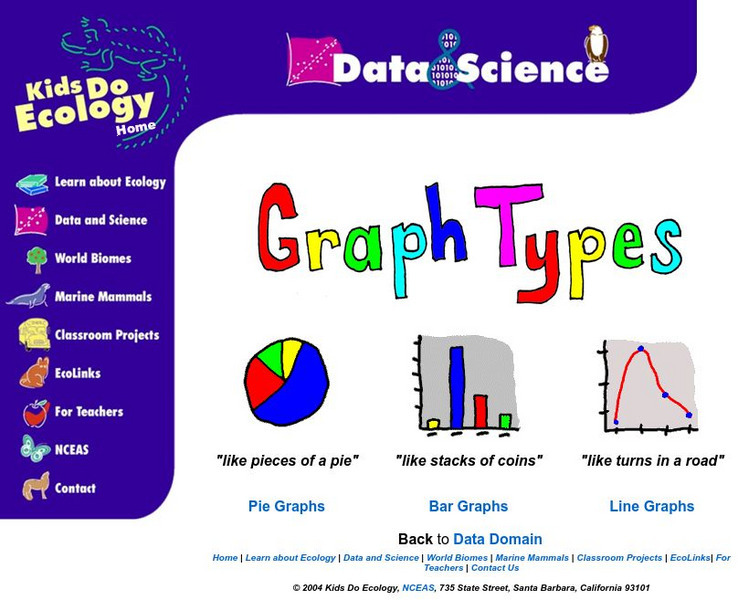
Nceas: Graph Types
At this site from NCEAS you can learn how to organize your data into pie graphs, bar graphs, and line graphs. Explanations and examples are given of each graph along with several questions that check comprehension.
McGraw Hill
Glencoe: Self Check Quizzes 2 Circle Graphs
Use Glencoe's Math Course 2 randomly generated self-checking quiz to test your knowledge of circle graphs. Each question has a "Hint" link to help. Choose the correct answer for each problem. At the bottom of the page click the "Check...
Shodor Education Foundation
Shodor Interactivate: Circle Graph
This site shows how to set up your own pie chart for papers and projects. Very colorful and it is free.
Oswego City School District
Regents Exam Prep Center: Practice With Organizing and Interpreting Data
Several problems are presented to test your skills in creating and interpreting frequency tables, pie charts, box-and-whisker and stem-and-leaf plots.
Texas Education Agency
Texas Gateway: Analyze Graphical Sources: Practice 2 (English I Reading)
This lesson focuses on practice exercises to understand and interpret the data in a graphic representations including pie charts, bar graphs, and line graphs.
Sophia Learning
Sophia: What Are Pie Charts?
This lesson defines the phrase pie chart. Students can look at a presentation and then take an online quiz.
Colorado State University
Colorado State Writing Center: Charts
The use of charts and graphs can improve your presentations, whether on paper or as visual aids. Here you can read about how to create line, column, bar, pie graphs, and scatterplots. Just follow the links to their respective pages.
Other
Abp: P Ie Charts
This site from Accelerators and Beam Physics Group produces pertinent information regarding pie charts. Shows an example of a pie chart and breaks it up for easy learning.
Varsity Tutors
Varsity Tutors: Hotmath: Algebra Review: Circle Graph
Find a quick, concise explanation of Circle/Pie Graphs. An example is given and step by step clearly explained.
ClassFlow
Class Flow: Using Graphs in History Class
[Free Registration/Login Required] This flipchart covers the major types of graphs used in social studies such as bar graphs, line graphs, pie graphs, and pictographs. Information on graphs is followed by graphs dealing with salaries...
Math Is Fun
Math Is Fun: Data Graphs
Create and customize a bar graph, line graph, or pie chart based on a set of data and print it out.
TeacherLED
Teacher Led Interactive Whiteboard Resource Survey
Students can explore surveys, pie charts, and bar graphs with this interactive white board resource.
US Department of Education
Nces: How to Create a Pie Chart
Resource from the National Center for Education Statistics provides tools and steps for creating printable pie charts online. Fill in the information, click the necessary buttons, and you have created a pie chart!
Other
Online Statistics Education: Graphing Distributions [Pdf]
This is the second chapter of a statistics e-text developed collaboratively by Rice University, University of Houston Clear Lake, and Tufts University. It looks at many different types of data displays and the advantages and...
Beacon Learning Center
Beacon Learning Center: Kinds of Graphs
An interactive web lesson introduces five types of graphs to students and allows them to practice matching the names to examples.
ClassFlow
Class Flow: Charts Handling Data
[Free Registration/Login Required] Reading graphs fit together with this engaging, colorful flipchart analyzing pie charts, bar graph, percents, and fractions.
PBS
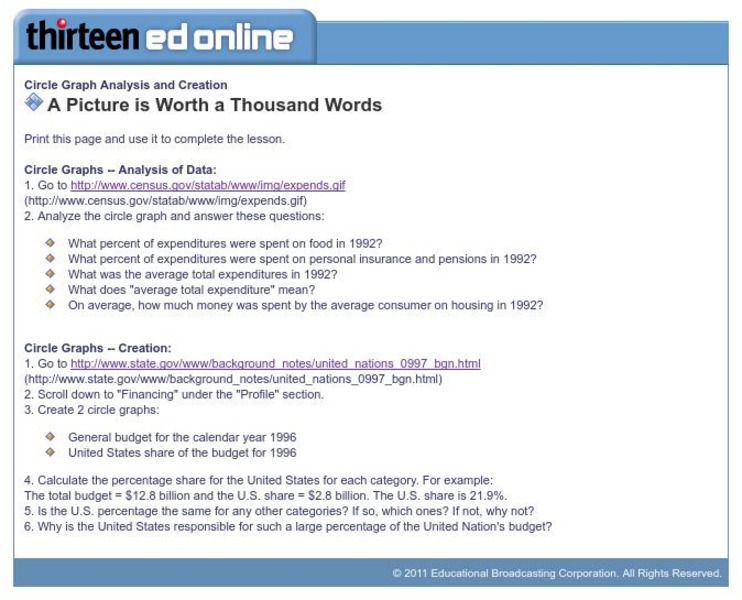
Wnet: Thirteen: Circle Graph Analysis and Creation
This site, which is provided for by WNET, gives a great way to practice using circle graphs through these exercises. One is analyzing a pie graph from the Census Bureau and the other creating pie charts using government data.


