Curated OER
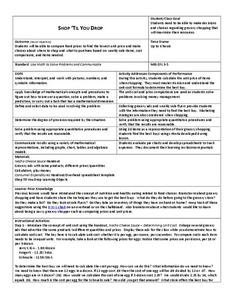
Shop 'Til You Drop
Students evaluate food prices. In this real world math lesson plan, students compare the cost of various grocery items to determine which is the best deal. They work in groups using grocery ads to decide how to get the most product for...
Curated OER
Using Excel To Teach Probability And Graphing
Students engage in the use of technology to investigate the mathematical concepts of probability and graphing. They use the skills of predicting an outcome to come up with reasonable possibilities. Students also practice using a...
Curated OER
Pumped Up Gas Prices
Students calculate gas prices. In this transportation lesson, students tally the mileage and gas costs of their car for one months. They figure out how much was spent on gas and create a graph showing average gas prices over time.
Curated OER
Statistics for Graphing
Students use the Internet to access a variety of websites that present statistics and information for use in graphing. They represent sports statistics, geographical measurements, temperatures and more.
Utah Education Network (UEN)
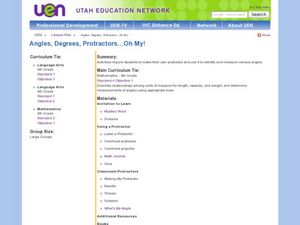
Angles, Degrees, Protractors . . . Oh My!
Fourth and fifth graders make a protractor and identify various angle types. In this protractor and angle activity, learners make their own protractor and use it to measure a variety of angles. They complete worksheets while identifying...
Curated OER
Questionnaires and Analysis
Students, review the techniques and different types of data analysis as well as how they are expressed, identify why facts and data are needed in conclusion of a questionnaire. The concepts of qualitative and quantitative data are...
Curated OER
Positive Future Fair Project
Ninth graders view the film "Pay It Forward" and discuss what kind of public campaign is needed to move people to positive action. They consider different ways of presenting information (graphs, visual displays, etc.) as tools for...
Curated OER
Candy Bar Survey
Second graders investigate the skill of graphing data by using candy bars to create context for the lesson. They use technology for graphing and organizing information like a spreadsheet. The lesson includes a resource link to aid in the...
Curated OER
Circle Graphs
Sixth graders interpret, create, and display data in a circle graph. In this circle graph lesson plan, 6th graders use a compass, protractors, pizza boxes, and more to create a circle graph and analyze the data they put into it.
Curated OER
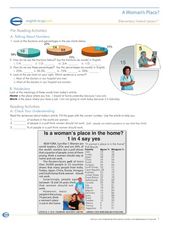
A Woman's Place?
In this women workers lesson, students read an article about women in the workforce and answer 10 questions related to the article. They also convert fractions to percentages.
Curated OER
Leaping Lemurs! How far can you jump?
Students watch a segment of the PBS video which show the lemurs' ability to jump. In pairs, students collect measurement data involving each other's length of a standard step, a standing broad jump, and a long jump. They record their...
Curated OER
M&M Caper
Learners participate in a game with M&M's to be introduced to percents and ratios. Individually, they estimate and record the number of candies they believe the bag holds and the amount of each colored candy. They open the bag and...
Curated OER
Bar and Histograms (What Would You Use: Part 1)
Students practice creating bar graphs using a given set of data. Using the same data, they create a group frequency chart and histograms. They must decide the best graph for the given set of data. They share their graphs with the...
Curated OER
Population Pyramids
Students create a population pyramid based on current data for their final project country. They analyze data from comprehension trends of final project country. Students analyze populations of specific countries.
Curated OER
Data Collection and Presentation
Students concentrate on discrete quantiative data. They are shown that the vertical line diagram as a more appropriate way to present discrete quantiative data then bar charts. Students work as a group to help with the interpretation...
Curated OER
Search for the Missing Pi
Third graders work in groups of two to three with measuring tapes, finding the circumference and diameter of teacher-selected circular items. They relate circumference and diameter measurements to find pi.
Curated OER
What's the Chance of Rain? Lesson Plan 2
Students utilize and interpret numerical statements regarding rainfall patterns which quantify chance. They design and prepare surveys and experiments to answer questions or test conjectures and predictions.
Curated OER
What's the Chance of Rain? Lesson Plan 3
Students conduct experiments involving chance to estimate the probability of rainfall patterns. They interpret and evaluate information contained in tables and databases.
Curated OER
Graphing
Fifth graders create graphs based on climate in South Carolina. They read and interpret information in a chart and construct a graphy from the information in the chart. They create a spreadsheet using Excel and publish 2 graphs.
Curated OER
Thank You... Thomas Edison!
Students investigate the life of Thomas Edison. They research how he made a difference. They understand that accurate data collection is important for math. They create a chart using spreadsheet data.
Curated OER
Data Analysis, Probability, and Discrete Math: Lesson 6
Eighth graders engage in a instructional activity that is concerned with the concepts surrounding the interpretation of information included in graphs for analysis of data for probability. They examine circle graphs and differentiate the...
Curated OER
Graphing a Healthy Lifestyle
Fifth graders record the amount of time they spend sleeping, attending school, watching T.V., exercising and doing homework. At the end of the week they graph all of their information and discuss how sleep impacts their learning....
Curated OER
Guess Your Best
Students discuss situations when it is useful to know exact weight of object as opposed to estimated weight, estimate weight of various items, weigh them on scale using ounces and pounds, and compare their weights on Guess Your Best...


