Hi, what do you want to do?
Sophia Learning
Sophia: Representing Data With Pie Charts: Lesson 4
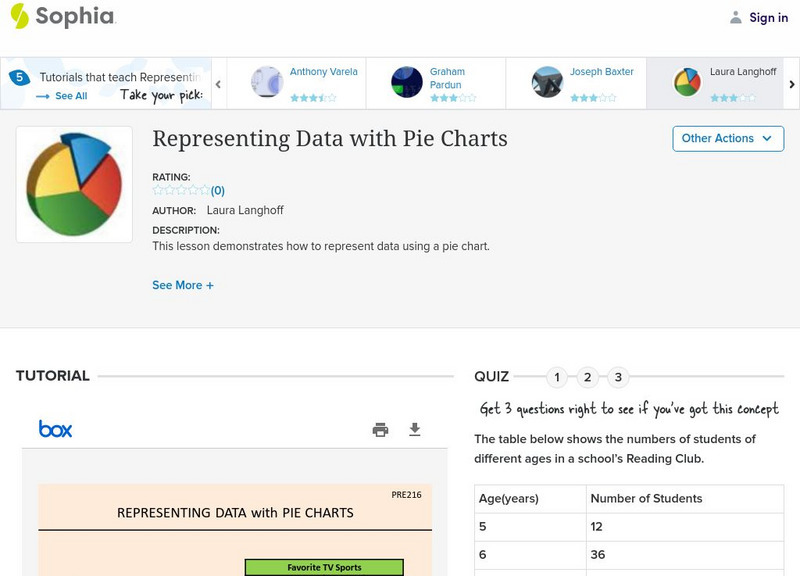
This lesson demonstrates how to represent data using a pie chart. It is 4 of 5 in the series titled "Representing Data with Pie Charts."
Other
Abp: P Ie Charts
This site from Accelerators and Beam Physics Group produces pertinent information regarding pie charts. Shows an example of a pie chart and breaks it up for easy learning.
Wolfram Research
Wolfram Math World: Pie Chart
This page briefly discusses the use of pie charts (or circle graphs) in representing data. Provides detailed information for understanding.
The Franklin Institute
Frankin Institute Online: Group Graphing
This site from The Franklin Institute explores how to make a simple graph using a spreadsheet to portray survey data. It also gives a set of interesting sports-related web sites so that students can get statistical inforamtion.
National Geographic
National Geographic: What the World Eats
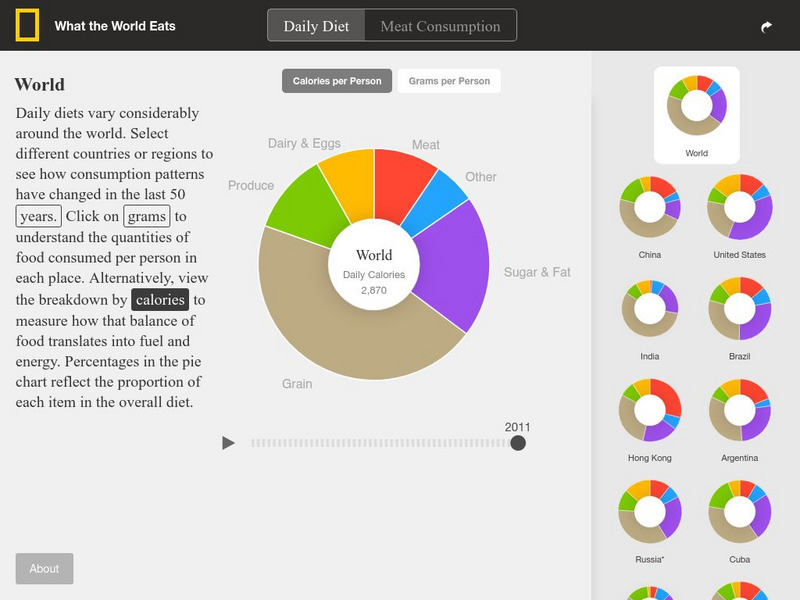
This interactive website offers pie charts showing what the world eats and what 22 different countries eat. It also allows you to choose by year as well. These include food groups, calories, and grams overall and per category.
Curated OER
University of Texas: Maps: Major Ethnic Groups in Central Asia
Here's a great map that shows all the different ethic groups in Central Asia with pie graphs for each country showing the percentage of the groups.
Curated OER
U. Of Texas: Yemen: Distribution of Ethnoreligious Groups and Key Tribal Areas
An interesting map showing the distribution of the major religious groups, the tribal areas, and pie graphs showing the percentages of ethnic groups and religious sects. From the Perry-Castaneda Collection.
Other
Mi Stupid: Composition of Air
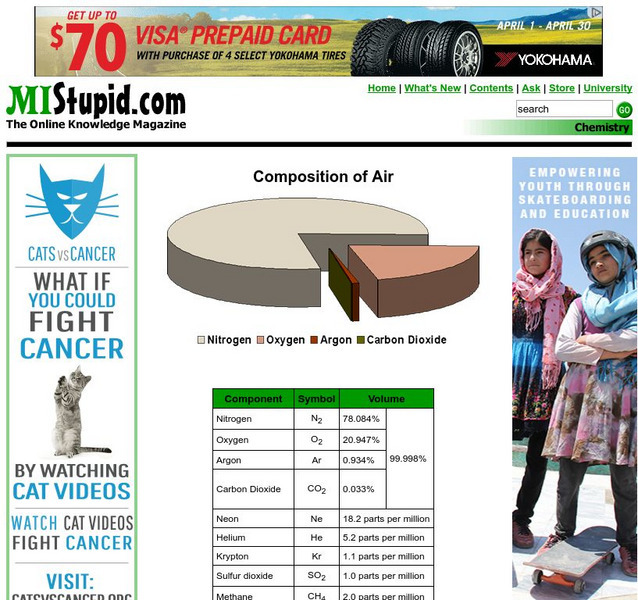
A pie chart showing the main elements that air is composed of, followed by a table with more detail, and a few facts about human respiration.
Curated OER
Wergeld
Contains a pie chart that illustrates how wergeld was to be distributed among family members.
Other popular searches
- Pie Charts and Graphs
- Interpreting Pie Charts
- Fraction Circles Pie Chart
- Circle Graphs Pie Charts
- Energy Pie Chart
- Reading a Pie Graph
- Creating a Pie Chart
- Bar Graphs, Pie Charts
- Pizza Pie Graph
- Nutrition Facts Pie Graph
- Pie Chart Activity
- M&m Pie Chart


