Curated OER
What is a Cloud
Third graders study clouds and how they are formed. They write acrostic poems about clouds and analyze and graph temperature data collected during varying degrees of cloud cover.
Alabama Learning Exchange
The Very Hungry Class
Students listen to a read aloud of Eric Carle's, The Very Hungry Caterpillar, as an introduction to their study of the metamorphosis of a butterfly. They participate in a number of cross-curricular activities in this unit of lessons.
Curated OER
FLIGHT FAIR
Students conduct their personal investigations into paper airplane flight. Cooperative teams are formed, with students choosing the paper airplane design that they are most interested in building.
Curated OER
Solar Power
Fifth graders create their own solar panel. They use this experiment to see how the sun can be used as a form of energy.
Curated OER
Plastic Packaging
Students collect data. In this math lesson, students collect data about recyclable materials. Students develop a plan that will help the environment. Recycling plastic containers is discussed.
Curated OER
Drawing Bugs Game
Second graders explore probability by playing a drawing game with dice. After they roll a die, they draw a tree diagram to illustrate each of the possible outcomes.
Curated OER
The effects of microgravity
Fourth graders are given a scenario in the lesson that presents a problem that needs to be solved. They conduct research from multiple sources in order to gather information. This is used to contribute to possible solutions proposed by...
Curated OER
Pumpkin Seed Data!
Second graders work with pumpkins to estimate, then accumulate data about pumpkin seeds. After cleaning out the pumpkins, 2nd graders utilize a worksheet imbedded in this plan which has a variety of pumpkin math activities they can do.
Curated OER
Classification Introduction
Students simulate classifying rocks using different colored skittles. In this earth science lesson, students create a Venn diagram according to their compiled information. They share this diagram in the class.
Curated OER
Telling Time to 5 Minutes
Students take part in various activities ranging from creating a human clock, to small group problem solving to reinforce the concept of telling time accurately to five minutes on an analog clock.
Curated OER
A Rainbow Under the Sea: How Do Animals Survive in the Ocean?
Second graders, with adult help, create a PowerPoint presentation on a selected ocean animal.
Primary Resources
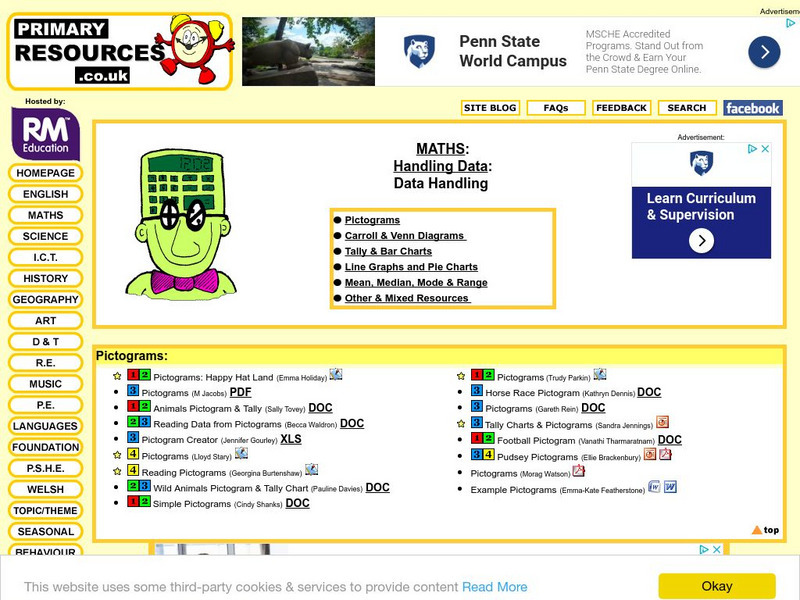
Primary Resources: Tally and Bar Charts
Lots of good materials for teaching about tally marks and bar graphs.
Khan Academy
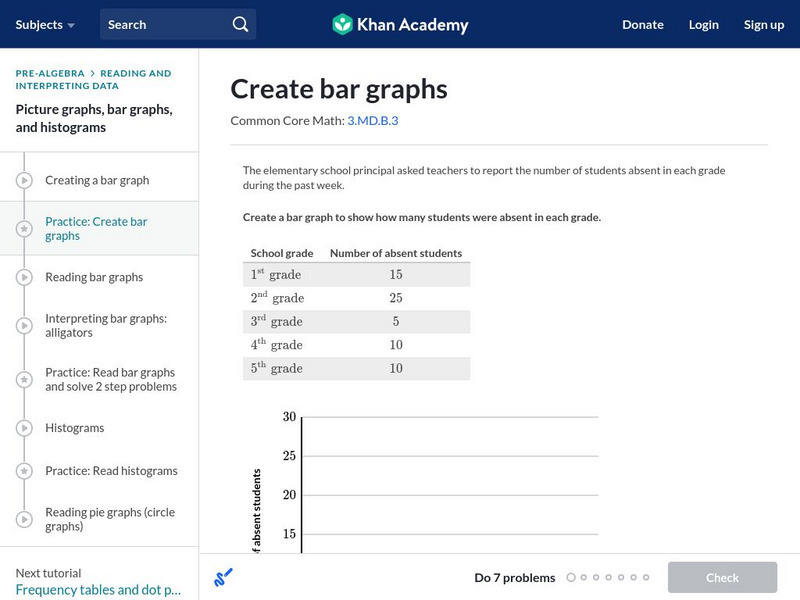
Khan Academy: Create Bar Graphs
Create a bar graph with the data given. Students receive immediate feedback and have the opportunity to try questions repeatedly, watch a video tutorial, or receive hints about creating bar graphs. CCSS.Math.Content.3.MD.B.3 Draw a...
Khan Academy
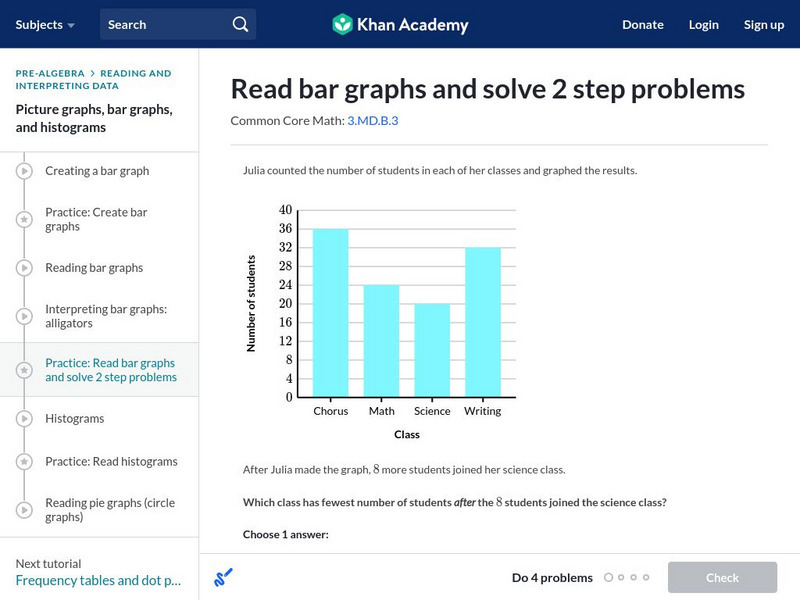
Khan Academy: Read Bar Graphs and Solve 2 Step Problems
Read and interpret a double bar graphs. Students receive immediate feedback and have the opportunity to try questions repeatedly, watch a video or receive hints. CCSS.Math.Content.3.MD.B.3 Draw a scaled picture graph and a scaled bar...
Khan Academy
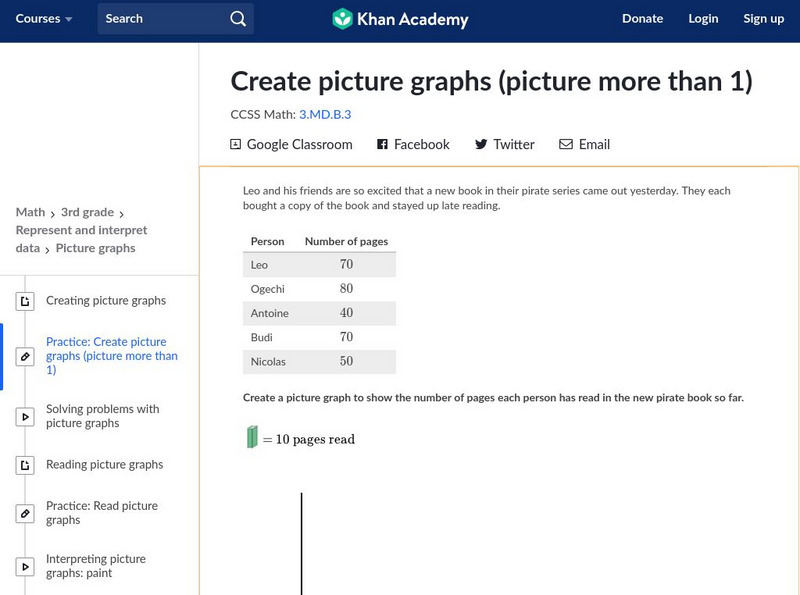
Khan Academy: Create Picture Graphs (Picture More Than 1)
Create and interpret picture graphs. Students receive immediate feedback and have the opportunity to try questions repeatedly, watch a video tutorial, or receive hints about how to create picture graphs. CCSS.Math.Content.3.MD.B.3 Draw a...
Education Place
Houghton Mifflin: Eduplace: Make a Living Bar Graph
Student use simple data to line up in a living bar graph activity when they respond to simple questions in this lesson plan. They physically and visually represent the data. CCSS.Math.Content.3.MD.B.3 Draw a scaled picture graph and a...
E-learning for Kids
E Learning for Kids: Math: Pizza (Italian) Restaurant: Data and Chance
In this interactive site, students practice with bar and picture graphs by helping a pizza place collect and analyze their data.
Better Lesson
Better Lesson: Graphing Our Snack Mix: Review of Graphing
Second graders review how to make bar graphs, line plots, and pictographs by tallying the contents of snack mix and building graphs to show their data.
ClassFlow
Class Flow: Data Analysis Using Graphing
[Free Registration/Login Required] This flipchart allows students to analyze data using appropriate graphs, including pictographs, histograms, bar graphs, line graphs, circle graphs, and line plots introduced earlier, and using...
Alabama Learning Exchange
Alex: Great Golly Graphs
This lesson plan asks students to create a survey project including graphs, questions, tables, and data analysis. It gives an assessment and ideas for remediation and extension as well as ways to manage behavior problems and reluctant...
Khan Academy
Khan Academy: Read Picture Graphs
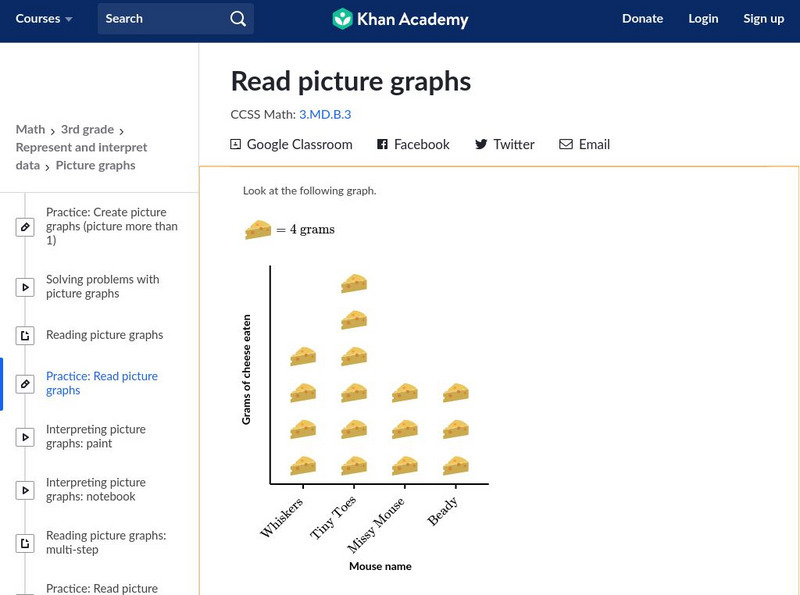
Use picture graphs to solve word problems. Students receive immediate feedback and have the opportunity to try questions repeatedly, watch a video or receive hints. CCSS.Math.Content.3.MD.B.3 Draw a scaled picture graph and a scaled bar...


