Hi, what do you want to do?
Curated OER
Percentages On A Grid
Fifth graders show percentages on a 10 x 10 grid. In this percentages lesson plan, 5th graders color in the squares to show a percent.
Noyce Foundation
Toy Trains
Scholars identify and continue the numerical pattern for the number of wheels on a train. Using the established pattern and its inverse, they determine whether a number of wheels is possible. Pupils finish...
Curated OER
Sea Ice: Cracking the Egg Code
Students study the egg code to learn about sea ice. In this sea ice lesson, students discuss and view a diagram to learn about the egg code when describing sea ice and its thickness. Students work in groups to play a game using the egg...
Curated OER
Let's Play the Stock Market
Eighth graders explore the basics about investing in the stock market, begin to see how the knowledge of decimals, fraction, and percents can be applied to financial profit or loss if investing in the market, and track their stocks using...
Curated OER
Ratios
In this ratio activity, students provide conversions for sets of ratios in charts, converting to fractions, decimals and percents. A website reference is given for additional resources.
Curated OER
Fraction Clue Box
Students distinguish between proper and improper fractions. They create a "Character Clue Box" that represents a fraction. Fractions are picked from a hat and then groups go outside and search for items that represent their fraction....
Curated OER
Ratio and Proportions
Students explore the means and extremes of a proportion, the how to make a scale drawing.
Curated OER
Ratio Relationships
Young scholars solve for the different ratio and proportion of a problem. In this geometry lesson, students show their knowledge of how to solve proportional relationships. They convert between percent, decimals and fractions.
Curated OER
Piece of the Sky: Introduction for Making S'COOL Observations
Students observe and discuss cloud cover. They identify percent of cloud cover, calculate cloud cover by fraction and convert to a percent, and compare their models with the current real sky cloud cover.
Curated OER
Population Ratios
Students access web site and record various population statistics pertaining to a county in the USA of their choice. They use this data to set up and solve ratios. They compare data to make meaning of the numbers.
Curated OER
Can I Afford This Apartment?
Students explore the concept of cost of living. In this cost of living instructional activity, students calculate the cost of living in an apartment along with other living expenses.
Curated OER
Texas History Math
Seventh graders practice math skills while they become familiar with Texas' Boom & Bust economy and the natural history of the east Texas Piney Woods.
Curated OER
“I Can” Common Core! 6th Grade Math
Help your sixth graders reach their Common Core math standards by providing them with a checklist of "I can" statements for each standard. As each concept is covered, kids can check it off, as long as they can do what it states.
Curated OER
Finding Discount and Sale Price
Seventh graders solve real-life problems involving sales tax, discount, and simple interest. They find the amount of discount. In groups, 7th graders examine a sales advertisement. Given a budget, they choose purchases, and figure the...
Curated OER
Aldridge Sawmill - The Story in Numbers
Seventh graders practice math skills while becoming familiar with Texas' "Boom & Bust" economy and the natural history of the east Texas Piney Woods. They utilize worksheets and websites imbedded in this plan.
Curated OER
Aldridge Sawmill - The Story in Numbers
Seventh graders view overhead maps of Texas, explore history of Aldrige Sawmill, and practice math skills while becoming familiar with Texas' "Boom & Bust" economy and natural history of east Texas Piney Woods.
Curated OER
Aldridge Sawmill -- The Story in Numbers
Seventh graders view a recent transparency of the average rainfall zones of the state of Texas. Using another transparency, they identify the Piney Woods subregion of the Gulf Coastal Plain and locate national forests and sawmills. ...
Curated OER
Graph a Panther's Diet
Learners examine the diet of panthers. In this interpreting data lesson, students collect data on the panther's diet and chart the data in bar and pie graphs.
McGraw Hill
Glencoe: Self Check Quizzes 1 Percents and Decimals
Use Glencoe's randomly generated self-checking quiz to test your knowledge of percents and decimals. Each question has a "Hint" link to help. Choose the correct answer for each problem. At the bottom of the page click the "Check It"...
Khan Academy
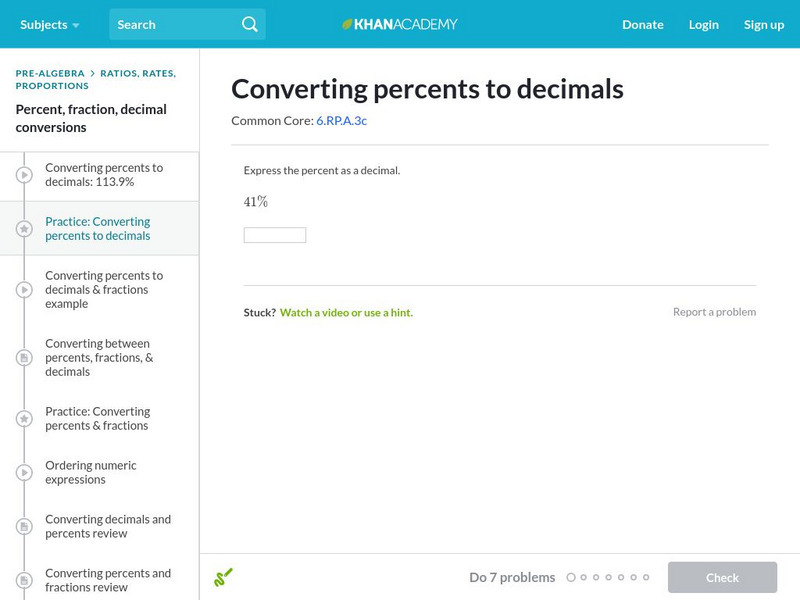
Khan Academy: Converting Percents to Decimals
Practice expressing a percent like 12.3% as a decimal. Students receive immediate feedback and have the opportunity to try questions repeatedly, watch a video or receive hints.
Shmoop University
Shmoop: Ratios & Percentages: Converting Percents to Decimals
The mathematics tutorial examines how to convert percents to decimals. Students learn about the concept through notes, examples, and practice problems.
Varsity Tutors
Varsity Tutors: Hotmath: Practice Problems: Percents 2
Twenty-eight problems present a variety of percent topics: percents as fractions, improper, and mixed numbers, percents as decimals, simple interest, and percent of increase/decrease. They are given with each step to the solution...
McGraw Hill
Glencoe: Self Check Quizzes 2 Fractions as Decimals
Use Glencoe's Math Course 2 randomly generated self-checking quiz to test your knowledge of writing fractions as decimals. Each question has a "Hint" link to help. Choose the correct answer for each problem. At the bottom of the page...
Education Development Center
Tune in to Learning: What's a Percentage?
Use this site to learn about percents, and how they relate to decimals and fractions with this interactive online lesson. You will learn about percents, convert percents into fractions and decimals, and find equal parts of a whole.


