Curated OER
Chemistry 231, Exam 3
This exam is aimed at assessing college level organic chemists. Ten problems are to be solved and include drawing molecular structures, assessing degrees of saturation, ordering alkenes according to stability, and explaining chemical...
Shodor Education Foundation
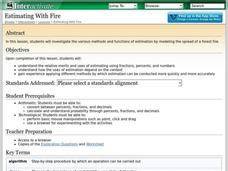
Estimating With Fire
Watch the damage from a forest fire in this interactive simulation activity that challenges learners to estimate the burn area using different approaches. Learners are given a worksheet to track the different burn patterns and practice...
Noyce Foundation
Truffles
Knowing how to scale a recipe is an important skill. Young mathematicians determine the amount of ingredients they need to make a certain number of truffles when given a recipe. They determine a relationship between ingredients given a...
Curated OER
Economic Health Indicators: GDP and CPI Worksheet
Examine the nation's economic health using this GDP and CPI worksheet, which features helpful graphic depictions of complex concepts. The first 2 pages include 17 short-answer questions intended to guide reading from a text (not...
Noyce Foundation
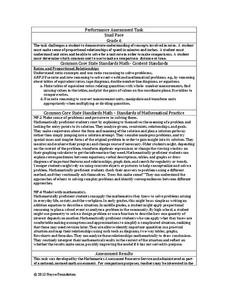
Snail Pace
Slow and steady wins the race? In the assessment task, scholars calculate the rates at which different snails travel in order to find the fastest snail. Hopefully, your class will move much more quickly in finishing the task!
Curated OER
Translate Word Phrases and Sentences into Equations
Use this video to show your learners an example of how to translate word phrases into an equation to solve a real-world problem. The presenter begins with a review of how to use cross products to solve a proportion, including how to do...
Curated OER
How Fast Is Your Car?
Eighth graders discover the relationship between speed, distance, and time. They calculate speed and represent their data graphically. They, in groups, design a ramp for their matchbox car. The goal is to see who's ramp produces the...
Curated OER
"Water is Life" Global Water Awareness
Students examine and calculate the percentage of potable water remaining on the earth. In this ecology and geography instructional activity, students brainstorm the main factors affecting water distribution. Students use mathematical...
Curated OER
2.0 "Water Is Life" Global Water Awareness Mini-Unit (Grades3-5)
Students study the amount of potable water on the Earth. In this water activity, students examine the amount of potable water as compared to all the water on the Earth. They discuss why many parts of the world do not have access to good...
Curated OER
How can we calculate the molecular weight of butane?
Students colloborate in a lab experiment. No OBJECTIVES.
Curated OER
Who Wants to Carry a Million?
Students, in groups, determine the volume of a box large enough to hold a million dollars. They calculate the dimensions of a bill and the volume of the money.
Curated OER
What's Its Slope
Learners identify the slope of a lines.For this algebra lesson, students define the meaning of slope and write an equation given the slope. They graph linear functions using the slope and y-intercept.
Curated OER
Percentages
In this percentages activity, students study the information and examples on a one page text. Students then solve 14 problems in which decimals and percentages are converted. Students also convert percentages to fractions.
Curated OER
Area graphics for 7th graders
Students randomly select dimensions for three geometric shapes (square, right triangle and circle). From the graphs they compare and contrast the graphical results of each shape.


