Curated OER
Graphing Regions: Lesson 2
Students identify and analyze geographical locations of inventors. They each identify where their inventor is from on a U.S. map, discuss geographic patterns, and create a t-chart and graph using the Graph Club 2.0 Software.
Curated OER
Probability Using M&M's
Students estimate and then count the number of each color of M&M's in their bag. In this mathematics lesson, students find the experimental probability of selecting each color from the bag. Students create pictographs and bar graphs...
Curated OER
Swimmy's Friends
Students solve problems using various strategies. In this problem solving lesson plan, students read the book Swimmy by Leo Lionni. Students make fish swimming patterns, measure how many goldfish crackers it takes to make a handprint and...
Curated OER
Stressed to the Breaking Point
High schoolers explore the relationship between the amount of weight that can be supported by a spaghetti bridge, the thickness of the bridge, and the length of the bridge to determine the algebraic equation that best represents that...
Curated OER
Creation and Interpretation of Voter Participation Graph
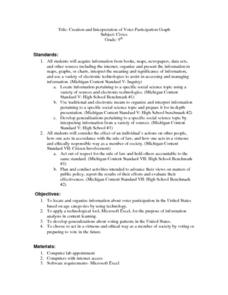
Ninth graders research information about voter participation in the United States based on age. They develop generalizations about voting patterns in the U.S and use Microsoft Excel to analyze the information.
Curated OER
Texas Commemorative Maps: Honoring Our Past
To celebrate Texas, groups plan and create a commemorative map for a topic or theme in Texas history. The richly detailed plan and the approach could easily be adapted to any state. Samples are included.
Curated OER
Using Excel To Teach Probability And Graphing
Students engage in the use of technology to investigate the mathematical concepts of probability and graphing. They use the skills of predicting an outcome to come up with reasonable possibilities. Students also practice using a...
Curated OER
Digital Statistics
Research data analysis by creating charts in class. Define the differences between an "average" and "range" while examining measurement data based on student height. Utilize computer software to create a height graph which is shared with...
Curated OER
Graph and Compare the Adventure's Temperature Vs. Local Temperature
Students explore the concept graphing data. In this graphing data activity, students use weather data from their local weather and some other city and graph them. Students plot the local weather vs. another city. Students record...
Curated OER
Perimeters, Patterns, and Conjectures
Students discover patterns and write conjectures relating to perimeters and polygons. Working in cooperative learning groups, they use manipulatives and graphic organizers to solve problems then answer a series of questions in which they...
Curated OER
The Snack Bar
Sixth graders complete a purchase order. In this ratios and patterns lesson, 6th graders work in groups to complete a purchase order for a grand opening of the school snack bar. Students use rations to figure out the need and quantity...
Curated OER
Timed Multiplication Test Graphs
Pupils use the tools of data analysis for managing information. They solve problems by generating, collecting, organizing, displaying histograms on bar graphs, circle graphs, line graphs, pictographs and charts. Students determine range,...
Santa Barbara City College
How to Make a Multiplication Table
Teach children how to make a multiplication table, and they'll be multiplying for life. Following this series of steps, young mathematicians learn to use patterns and the relationships between numbers to create their very own...
Curated OER
The Hajj: Muslim Pilgrimage in a Geographic Perspective
Students read information on the Hajj. They discuss pilgrimage and ways it differs from going to a church, mosque or synagogue. Students discuss logistical problems that might be posed for the host country of a pilgrimage. Students do an...
American Statistical Association
Scatter It! (Predict Billy’s Height)
How do doctors predict a child's future height? Scholars use one case study to determine the height of a child two years into the future. They graph the given data, determine the line of best fit, and use that to estimate the height in...
Missouri Department of Elementary
Are You Balanced?
Balance scales create a strong visual of how an individual prioritizes one's self alongside their commitments to the community, school, and home. Scholars complete a graphic organizer then discuss their findings with their peers. A...
Missouri Department of Elementary
My Conflict Shield
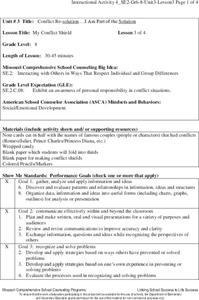
As an exercise in self-awareness and improvement, class members create a Conflict Shield listing 12 skills they believe are the most useful in conflict resolution. They then color the ones they have mastered while leaving uncolored those...
Curated OER
Virtual Field Trip
This hands-on resource has future trip planners analyze graphs of mileage, gasoline costs, and travel time on different routes. While this was originally designed for a problem-solving exercise using a Michigan map, it could be used as a...
Curated OER
How Many Toothpicks?
Students investigate different geometric patterns. For this geometry lesson, students create different shapes using toothpicks. They create different patterns and designs and complete a charts using different measurements.
Curated OER
Let's Line Them Up!
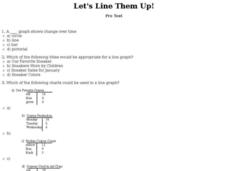
In this line graph worksheet, students read through the problems about graphing and line graphs. Students select the best answer to solve the 10 online questions.
Curated OER
Migration of the Neo-Tropical Songbirds
Fifth graders plot the migration of birds using Google Earth. In this lesson on bird migration, 5th graders work in groups to plot the migration of a group of birds using Google Earth. Students present and discuss their findings and look...
Curated OER
Place Value
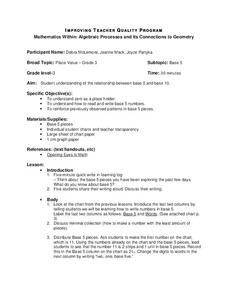
Third graders study the relationship between base 5 and base 10. They determine zero is a place holder and how to read and write base 5 numbers. They reinforce previously observed patterns in base 5 pieces. They choose another base and...
Curated OER
Graphing Family Reading Habits
Second graders collect data from their families about their reading habits and graph them. In this graphing family reading habits lesson, 2nd graders interview family members about their reading habits. They then use a graphing computer...
Curated OER
There Is A Lady In The Room
Students use magnifiers to observe the characteristics of ladybugs. From recorded observations and gathered data, they construct patterns and graphs of their favorite ladybugs. Children listen to a book on The Grouchy Ladybug and...


