Curated OER
Beatrix Potter Book Survey
In this survey activity, students ask classmates which Beatrix Potter books they have read and record their responses. Book titles are listed in the first column and tally marks are written in the second column. Students then graph the...
Curated OER
You Sank My Battleship
Students apply the concept of transformation to the game of battleship. In this algebra lesson plan, students relate their linear equations to how they would graph or set up their game pieces to win.
Curated OER
Quadratic Functions
Students explore the concept of quadratic equations. In this quadratic equations worksheet, kids determine what shifts of a parent graph will look like by describing in sentences. Students factor quadratic expressions and solve...
State of Michigan
Pre-K Mathematics
Kick-start children's education with this pre-school math unit. Offering 31 different hands-on learning activities that develop young mathematicians' pattern and shape recognition, basic number sense, and much more, this is a must-have...
Curated OER
This is My Neighborhood
Young scholars predict the things that they may see, smell, or hear in their neighborhood. They take part in a neighborhood walk, creating a rough map of their neighborhood as they go. Upon return to the classroom, students create a...
Curated OER
Rainbows, Bridges & Weather, Oh My!
Explore how real-world applications can be parabolic in nature and how to find quadratic functions that best fit data. A number of different examples of modeling parabolas are explored including a student scavenger hunt, the exploration...
Curated OER
Graphing Square Root and Other Radical Functions
In this activity, students graph the square root and other radical functions by examining the parent function and the translations and shifts that occur within the function family. The two page activity contains twelve problems.
Intel
Choreographing Math
Leaners investigate families of linear functions through dance. They choreograph dance moves to model nine unique linear functions of their choosing. Using their dance moves, teams create a video presentation complete with music and...
Curated OER
Transformations with Functions
In this transformations worksheet, students solve and graph 8 different problems related to various forms of functions. First, they write the equation for the graph of a function given. Then, students describe the transformations that...
Curated OER
How Many People Live in Your Household?
Students create a pictograph showing household size for the class.In this data collection and graphing lesson, the teacher guides students through the creation of a concrete object graph, then students analyze and summarize the results.
Curated OER
Literacy Activity: The Perfect Pet
Students develop their listening skills as they listen to the book The Perfect Pet. For this reading lesson, students listen to the book, and then talk about the pets they have. Then they make a graph as a class of all their pets.
Curated OER
Pick a Pet
Students construct a pictograph of favorite pets. In this pets and graphing lesson, students discuss their favorite pet and use animal magazines to find their favorite pets and cut them out. Students create a pictograph using the pictures.
Curated OER
Healthy Food Choices
Students identify healthy food choices. In this nutrition instructional activity, students review the food pyramid and write down their favorite food on a post-it note. Students create a bar graph of favorite foods using the post-it notes.
Curated OER
Wind
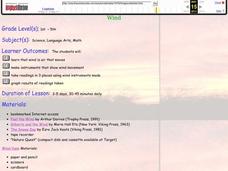
Students make a wind vane, anemometer, wind spiral, and wind streamer to calculate wind movement. In this wind lesson plan, students test each of their wind instruments, and graph the results of the wind speed in different locations.
Curated OER
The Weather Around Us
First graders explore weather patterns. In this weather lesson, 1st graders research the daily weather by creating a graph of the daily weather conditions. Students use the computer to access information regarding the weather forecast....
Curated OER
Spreadsheet Graphs
Students create graphs using information from spreadsheets. They select a topic from the following choices: website use, digital cameras, spreadsheets, calculators or educational software. They tally the class results and create an...
Curated OER
Healthy Heart Parent Night
Students use a smoke analysis machine and create a visual display to show risks involved in smoking. In this cigarette smoking lesson, students demonstrate how to use a smoke analysis machine and show results in a visual display....
Curated OER
Are You My Little Peanut?
Fourth graders explore the mass and length of peanuts by pretending to parent a peanut. In this mode, median and range lesson students graph their measurements and then use them to find the mode, median and range. Students discuss peanut...
Curated OER
Map Your School
Learners participate in a project to map their school. They measure and graph various areas around the school. Students find the longitude and latitude of the school and research the school's history, and highlight special important areas.
Curated OER
The Impact
Learn about the destruction of the rainforest by analyzing statistics. Young learners make an original line graph showing destruction in the rainforest. Additional activities include making a collage, sequencing Dr. Seuss' The Lorax,...
University of Pennsylvania
Evolution by Natural Selection
A diagram, data table, and reading passage top this resource. Through it, biology beginners are introduced to the concept of natural selection. They answer some questions and then participate in a simulation using fabric as a habitat and...
Curated OER
Virtual Field Trip: Lesson Ten - Publishing
Class members publish a letter describing their Virtual Field Trip incorporating data from previously developed charts, graphs, and data tables. The final lesson in a series devoted to collecting information and publishing data.
CK-12 Foundation
CK-12 Middle School Math Concepts - Grade 6
Twelve chapters cover a multitude of math concepts found in the Common Core standards for sixth grade. Each title provides a brief explanation of what you will find inside the chapter—concepts from which you can click on and learn more...


