Curated OER
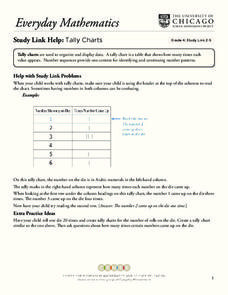
Tally Charts
For this tally charts worksheet, students discuss how to use a tally chart and how to read the chart. Once students record information on a tally chart they answer questions showing their ability to read a tally chart.
Curated OER
Transforming Parabolas
In this Algebra II worksheet, 11th graders examine the affects of changing h and k in the vertex form of the parabola. The three page worksheet provides explanation of topic, worked examples, and four practice problems. Answers are not...
Curated OER
Weather Instrument Data Chart 2
For this science worksheet, students look for the data that is needed to fill in the graphic organizer. The prefixes are given that are needed to sort the information as it is collected.
Curated OER
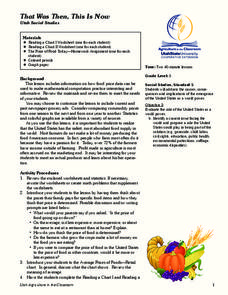
That was Then, This is Now
Students compare and contrast data charts and statistics for food prices of now and in the past. In this food prices lesson plan, students answer short answer questions and calculate computations.
Curated OER
Monument Museum
Students design monuments, taking into account what is known about geometric shapes and measuring. Students create a museum complete with monuments and descritions of the monuments. Students provide guides at each monument in order to...
Curated OER
Survey: What is Your Favorite Rainforest Animal?
In this favorite rainforest animal survey worksheet, 1st graders will survey their classmates about which animal is their favorite. There are 12 animal choices. Students will record responses by making tally marks.
Curated OER
What Do You Think About Radon?
Students complete a survey about radon in their homes. They calculate the averages for each question. They graph the averages and discuss the results.
Curated OER
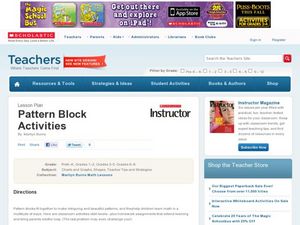
Pattern Block Activities
Students practice various math skills by using manipulative activities. In this math manipulative lesson, students sort shapes, build hexagons, and build shapes using manipulatives. These activities would be great for parent ed or...
Curated OER
What Can Scatterplots Tell Us?
Eighth graders use data from surveys conducted with parents, peers and themselves to create computer-generated scatterplots. They make inferences from their scatterplots.
Curated OER
Population Growth
Students investigate the biodiversity of living things and how they are interdependent upon each other. They conduct research using a variety of resources. Specifically students create a graph to show how a population can grow in an...
Curated OER
Vertical and Horizontal Translations
Eleventh graders study seven functions. They use their handheld calculator to determine which family of functions the equation belongs, the parent function described, and they calculate the vertical and horizontal translation.
Curated OER
Launching Rockets
Second graders discuss experiences of watching a rocket launch either on television or in person before making paper rockets. They make and color rockets which they attempt to launch using a strong breath blown through a straw at the...
Curated OER
What Do People Know About Radon?
Students complete a survey about how much they know about radon. They calculate the mean scores for each question and graph them. They discuss the results as a class.
Curated OER
What Do People Know About Radon?
Pupils complete and discuss a radon survery. They calculate the average for each question based on the response. They graph the responses and analyze the information.
Curated OER
Adventures along the Oregon Trail in Nebraska
Students discover how the land and people we develop relationships with in Nebraska affect our survival--past, present, and future. They write about and interview their grandparents, parents and peers and compare them with people on the...
Curated OER
Off to College
Students jog to where their classroom teacher went to college using a scale that best fits their situation. They log miles on a chart until students reach their destination. Students use the colleges mascot as the graph indicator as to...
Curated OER
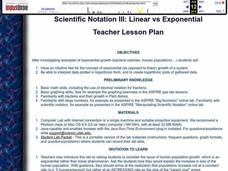
Scientific Notation III: Linear vs Exponential
Learners examine the differences in exponential growth and linear growth of a system. They interpret data on graphs and develop their own charts. They answer discussion questions as well.
Curated OER
Estimation of Population Growth By Counting Offspring: Seed Multiplication
Students calculate the reproductive rate of a plant that creates multi seed fruits. They graph exponential growth and the complete a series of questions that help them infer that natural selection processes are at work in this population.
Curated OER
Cultural Corner- "Mexico"
Students use print and electronic resources to gather information about Mexico. They present a mini-museum to share with students, parents, and other interested classes around the district. They present their information in a video...
Curated OER
Blowing in the Wind
Students identify and interpret maps, graphs, charts, tables and political cartoons. Students identify what a compass rose is and review its meaning in relation to standard directions. Students design their own weathervanes. Students...
Curated OER
Late Bloomers
Learners demonstrate an understanding that individuals grow at various rates. For this health lesson, students read Leo, the Late Bloomer and identify ways to be tolerant of others. Learners record the height of classmates and graph the...
Curated OER
Is There a Doctor in the House
Sixth graders predict outcomes of research. They analyze data and construct a class graph, then work cooperatively in a small group setting. They explain the prevention aspect of medicine, document references, and continue ongoing...
Curated OER
Design-a-Lesson-Packaging a Product
Students in a teacher education class address consumer related issues involving packaging. Using volume, surface area and graphs, they create a package for a given volume of a product. They design modifications for this lesson and to...
Curated OER
Demography of Roosevelt Over Time
Students examine how the demographics of their high school have changed over time. After collecting and graphing data, they write their conclusions. They share their analysis with the class and compare them with others.


