Curated OER
What's in a Graph?
How many yellow Skittles® come in a fun-size package? Use candy color data to construct a bar graph and a pie chart. Pupils analyze bar graphs of real-life data on the Texas and Massachusetts populations. As an assessment at the end...
Pace University
Grade 7 Earth Day Statistics with Circle and Bar Graphs
Take a tiered approach to studying waste. The lesson uses Earth Day to present differentiated instruction around using circle and bar graphs. Each group gets a cube based on their tiers and works collaboratively as well as individually...
Curated OER
Graph a Panther's Diet
Students examine the diet of panthers. In this interpreting data lesson, students collect data on the panther's diet and chart the data in bar and pie graphs.
Curated OER
Tables, Charts and Graphs
Learners examine a science journal to develop an understanding of graphs in science. For this data analysis lesson, students read an article from the Natural Inquirer and discuss the meaning of the included graph. Learners...
Curated OER
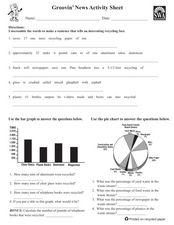
Groovin' News Activity Sheet
In these recycling worksheets, students complete several activities to learn about recycling. Students complete a word search, word scramble, bar graph, pie chart, research project, class project, and individual project for recycling.
Consortium for Ocean Science Exploration and Engagement (COSEE)
Climate Change Impacts on Blue King Crabs
Carbon dioxide is not only causing global temperatures to increase, it causes the oceans to become more acidic. Lesson focuses on the blue king crab and the fragility of the habitat due to climate change. Scholars create a concept map...
Curated OER
Recycling Statistics
In this environment worksheet, students look for the answers to the environmental impact of recycling in Great Britain with the statistics from the pie graph.
Curated OER
Where in the World Is All the Water?
Students investigate the distribution of the earth's water. They conduct a demonstration of water distribution, and create a pie graph to display the results.
Curated OER
How Much Soil is There?
Students examine that all living things depend on soil to live. In this science lesson, students pretend that an apple is planet Earth. Students cut the apple to represent the portions of Earth with the last section representing soil.
Curated OER
Fourth Grade Science
In this science worksheet, 4th graders answer multiple choice questions about natural objects, rainfall, the solar system, and more. Students complete 25 questions.
Curated OER
Pond Theme Unit
In this pond theme activity students research facts on pond life. Students complete comprehension questions, crosswords, word search, and math puzzles. Students write a short report.
Curated OER
Properties of the Ocean: Change
Students research and create a visual presentation on the seasonal salinity of the Earth's oceans. They apply the research in a simulation of a lab disaster in which they must relabel ocean samples.
Curated OER
Oobleck/Slime War
Young scholars compare slime recipes. In this properties of matter lesson, students make Oobleck and glurch and compare the properties of each and examine the solid and liquid properties of them.
Curated OER
Garbage Pizza
Fourth graders explore the concept of waste management. In this recycling lesson, 4th graders identify materials that must be landfilled as well as items that may be recycled or reused.
Curated OER
Blue Genes: Affect Your Life!
Students, in groups, research, analyze and synthesize information on genetic diseases. After watching a video on genetics, groups perform research on a variety of genetic diseases and present their findings to the class.
Curated OER
Leaping Lemurs! How far can you jump?
Learners watch a segment of the PBS video which show the lemurs' ability to jump. In pairs, students collect measurement data involving each other's length of a standard step, a standing broad jump, and a long jump. They record their...
Curated OER
Technology has a Solution!
In this technology instructional activity, students summarize four things they learned about technology and the environment. Students then write a report that outlines how technology is solving environmental issues.
Curated OER
A Look at the Life That Electronics Lead
In this comprehension worksheet, students fill in ways on a graphic organizer that people or companies can conserve energy, reduce waste or minimize the impact to the environment. Next, students solve 3 "environmental" math word problems.


