Curated OER
Which Graph is best?
Students use commercial software to organize and visually display data to draw conclusions; students use graphing software to create several types of graphs illustrating the number of each color of M&M's in one bag.
Curated OER
Data Handling
In this data handling worksheet, 6th graders solve and complete 4 various types of problems. First, they draw a bar chart to represent the information provided in the table shown. Then, students show beneath the table how to work out the...
Curated OER
Tables, Charts and Graphs
Learners examine a science journal to develop an understanding of graphs in science. For this data analysis lesson, students read an article from the Natural Inquirer and discuss the meaning of the included graph. Learners...
Curated OER
Equal Parts
In this equal parts worksheet, students, working with a partner, study, formulate and calculate the answers to six word problems or drawings.
Curated OER
Pond Theme Unit
In this pond theme activity students research facts on pond life. Students complete comprehension questions, crosswords, word search, and math puzzles. Students write a short report.
Curated OER
Publishing Autobiographies 2
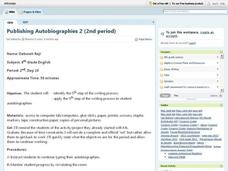
Eighth graders identify the 5th step of the writing process and apply the process to student autobiographies. While in the computer lab, they continue to type their autobiographies, and create covers for their autobiographies.
Curated OER
Blue Genes: Affect Your Life!
Students, in groups, research, analyze and synthesize information on genetic diseases. After watching a video on genetics, groups perform research on a variety of genetic diseases and present their findings to the class.
Curated OER
Informational Reading: Electronics Are Made from Resources
For this comprehension worksheet, learners read about the making of a computer: circuit boards, hard drives, monitors and plastic housings. Students then answer 3 multiples choice questions.
Colorado State University
Colorado State Writing Center: Charts
The use of charts and graphs can improve your presentations, whether on paper or as visual aids. Here you can read about how to create line, column, bar, pie graphs, and scatterplots. Just follow the links to their respective pages.


