Curated OER
The Regression Line and Correlation
Students investigate the best fit line through plotting on the TI. In this math instructional activity, students examine their data representing regression lines and correlation. They use interactive technology to differentiate between...
Curated OER
Concepts in Measurement
Students measure the diameter and circumference of cylinders. For this physics lesson, students record and graph experimental data. They calculate the slope and determine outliers.
Curated OER
comparison of Two Gender Sports Teams
Learners gather data on sports team and create a box and whisper plot. In this data collection instructional activity, students find the median, the quartile range, and relationships between variables.
Curated OER
Stemplots
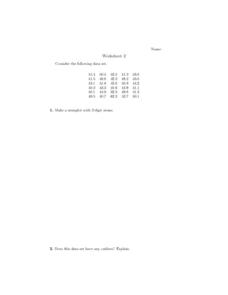
In this stem plot learning exercise, students construct 3 stem plots. Students answer 1 question about outliers and another question regarding which stem plot is preferred.
Statistics Education Web
It’s Elemental! Sampling from the Periodic Table
How random is random? Demonstrate the different random sampling methods using a hands-on activity. Pupils use various sampling techniques to choose a random sample of elements from the periodic table. They use the different samples to...
Curated OER
Mean, Median, Mode, etc.
Explore the concept of mean, median, and mode with pupils. They estimate the length of a string or the number of M&M's in a jar. Then find the mean, median, and mode of the class' estimates.
Curated OER
Recognize, create and Record Simple Repeating Patterns
Learners analyze, create, and record repeating patterns. In this geometry lesson, students create shapes using patterns and keep track of the different shapes. They incorporate transformation and reflections into their patterns.
Curated OER
In A Heartbeat
Students discuss scatter plots then create a class scatter plot using their heart rate at rest and their heart rate after a few minutes of aerobic exercises. Students copy the points plotted as a class and create individual graphs...
Curated OER
Search for the Missing Pi
Third graders work in groups of two to three with measuring tapes, finding the circumference and diameter of teacher-selected circular items. They relate circumference and diameter measurements to find pi.
Curated OER
Measuring the Earth (Eratoshenes' method)
Sixth graders engage in problem solving, communicating, reasoning, and connecting to represent and solve problems, using geometric models.
Alabama Learning Exchange
The State Capital of Stem and Leaf
Students explore the concept of stem and leaf plots. For this stem and leaf plots lesson, students plot the 50 US states' capitals on a stem and leaf plot according to the first letter of each state. Students compare their stem and...
Curated OER
Finding Mean, Mode and Median in the Computer Lab
Students create spreadsheets which will display and figure mean, median, and mode of a set of numbers.


