American Statistical Association
What Fits?
The bounce of a golf ball changes the result in golf, mini golf—and a great math activity. Scholars graph the height of golf ball bounces before finding a line of best fit. They analyze their own data and the results of others to better...
College Board
2004 AP® Statistics Free-Response Questions Form B
Over the years, data analysis has been important. Looking back to the 2004 AP® Statistics Form B free-response questions, pupils and teachers see the importance of analysis of data sets. The six questions contain analysis of data on...
Radford University
Let's Buy a Car
Ready to buy a car? Learners research different makes and models of cars to decide on the best one to buy. They collect data on cost, fuel efficiency, safety ratings, and insurance costs, then create and analyze data displays to make...
Flipped Math
Unit 4 Review: One Variable Statistics
It's always nice to slow down and review. Scholars work on problems covering concepts on one-variable statistics. They create and interpret box plots and stem-and-leaf plots, determine the mean, median, mode, interquartile range, and...
Curated OER
Steppin' Out
Students are presented with the question: "Do longer legged people run faster than shorter legged people?" Students conduct an experiment, collect their data, create box and whisker plots using a computer and graphing program, and...
Curated OER
My Peanut Butter is Better Than Yours!
Students explore the concept of statistical data. In this statistical data lesson, students read an article about the dangers of peanut butter to those who are allergic. Students perform a taste test of two different brands of peanut...
Curated OER
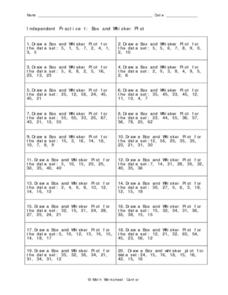
Independent Practice 1: Box and Whisker Plot
In this box and whisker plot instructional activity, students create a box and whisker plot from a given set of data. They identify the lower quartile, upper quartile, the mean, and outliers. This one-page instructional activity...
Curated OER
Center and Spread
Students collect and analyze data. In this statistics lesson, students define and calculate the range, median and standard deviation. They identify reasons for a skewed distribution.
Curated OER
Line Plots
In this line plot instructional activity, students create a line plot of given data. They identify the range, clusters, gaps, and outliers. This one-page instructional activity contains 8 multi-step problems.
CK-12 Foundation
Mean: Arithmetic Mean
How is a mean affected by changes in data? A well-designed animation allows individuals to manipulate data and watch the effect on the mean. Challenge questions help guide users to conclusions about outliers and skew within data.
US Department of Commerce
Does the Percentage of People Who Walk to Work in Cities Vary with Population Size?
To walk or not to walk? Pupils create box plots comparing the percentage of residents who walk to work in large, medium, and small cities. Using the box plots, class members compare the data that reflects available statistics. Scholars...
Statistics Education Web
Using Dice to Introduce Sampling Distributions
Investigate the meaning of a sample proportion using this hands-on activity. Scholars collect data and realize that the larger the sample size the more closely the data resembles a normal distribution. They compare the sample proportion...
101 Questions
Representative Sample
At what point does data switch from being an outlier to part of the average? Scholars view conflicting news articles about protesters. They must decide which, if any, side is using the correct sample to draw their conclusions. It's a...
Curated OER
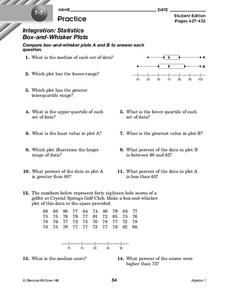
Box-and-Whisker Plots
In this box-and-whisker plots worksheet, 9th graders solve and complete 14 different problems that include comparing various box-and-whisker plots. First, they determine the median for each set of data and plot the lesser range. Then,...
Curated OER
Scatterplots
In this scatterplots learning exercise, students construct a scatter plot from a given data set. Students then answer 4 questions regarding the least-squares regression line and making predictions.
Curated OER
Statistics
For this statistics worksheet, 9th graders solve and complete 5 various types of problems related to determining statistics. First, they determine the data set where the median value is equal to the mean value. Then, students determine...
Curated OER
Univariate Data Analysis
Students use given data to compare baseball players. They create box and whisker plots to compare the players and determine which they feel is the best player. Students use calculators to make box and whisker plots. They write paragraphs...
Curated OER
Multiply Boxplots
Students identify the mean, quartiles and range of a boxplot. In this statistics lesson plan, students identify cooperative boxplot as it relates to the data. They make conjectures about students grade distribution.
EngageNY
Patterns in Scatter Plots
Class members investigate relationships between two variables in the seventh installment of a 16-part module that teaches scholars how to find and describe patterns in scatter plots. Young mathematicians consider linear/nonlinear...
American Statistical Association
How Tall and How Many?
Is there a relationship between height and the number of siblings? Classmates collect data on their heights and numbers of brothers and sisters. They apply statistical methods to determine if such a relationship exists.
Georgia Department of Education
The Basketball Star
Have learners use math to prove they are sports stars! Assess a pupil's ability to create and analyze data using a variety of graphs. The class will be motivated by the association of math and basketball data.
Curated OER
How's The Weather?
Students make a box and whiskers plot using the TI-73 graphing calculator. Each student would have their own calculator but they would work in small groups of two or three to help each other enter the data and make the plots.
Curated OER
Mean and Standard Deviation
Get two activities with one lesson plan. The first lesson plan, is appropriate for grades 6-12 and takes about 20 minutes. It introduces the concept of measures of central tendency, primarily the mean, and discusses its uses as well as...
Curated OER
Height versus Shoe Size
Middle schoolers find a correlation between a person's height and his/her shoe size. They have access to entering data into lists on a graphing calculator and can complete scatter plots. Students read and interpret a scatter plot and use...


