Curated OER
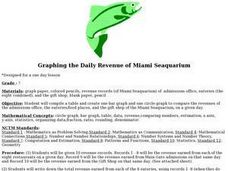
Graphing the Daily Revenue of Miami Seaquarium
Seventh graders compile a table of the revenues of the 8 eateries (a combined total), Main Gate admissions, and the Gift Shop.
Curated OER
How Can You Study Things You Can’t See Like: Atoms?
Students simulate how scientists studied things they can't see like atoms. In this chemistry lesson, students predict what is inside the numbered obsertainers. They design a way to investigate what's inside without opening it.
Curated OER
Japan: A Cultural Study
Third graders "take a trip" to Japan. They discover what life is like for a typical Japanese child and compare/contrast it to life in America. They give an oral presentation of Japanese holidays and festivals.
Curated OER
Life...Bring It On!
Eighth graders write their name however they see fit on a poster board. Individually, they write down their strengths that relate to them making important decisions around their name. To end the lesson, they use magazines to find...
Curated OER
Calendar Communication
Students identify days, dates, and month on a calendar. In this calendar lesson, students use a blank calendar page and fill in the days of the month. Students recall what they learned on specific days and record that information as well.
Curated OER
The Seasonal Round and The Cycle of Life
Fourth graders are introduced to the concept of the seasonal round and how folklife traditions vary from season to season. They begin charting dates of personal interest on seasonal round calendars by starting with birthdays. Students...
Curated OER
Chew on This
Eighth graders explore and demonstrate the seven steps of the scientific method. They predict how much sugar is in chewing gum and test, analyze, and calculate the sugar content of gum.
Curated OER
Where In the World Are We?
Fifth graders read postcards and find their locations on maps. They use the pictures and text on the postcards to write about imaginary vacations. They compute the mileage and compare it to TripMaker data.
Curated OER
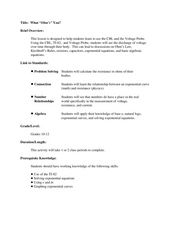
What "Ohm's" You?
Students use the CBL and voltage probe to observe electricity. In this algebra instructional activity, students use the TI calculator with the CBL to explore Ohm's Law. They discuss exponential equations and how it relates to...
Curated OER
Magical Metamorphosis
Sixth graders compare and contrast incomplete and complete metamorphosis using a Venn Diagram. They predict, observe, measure, and record data on the life cycle of mealworms. Students write and illustrate the life cycle of the mealworm....
Curated OER
Cancer: A Crisis of the Cells
Students analyze cancer data represented in graphs and charts. They describe the changes in cell structure and function as the result of cancer. They also examine phenomenas that are believed to cause cancer.
Curated OER
Put Your Heart Into It
First graders sort Valentine candies according to kind. Data is inserted into a spreadsheet and displayed in various graphic formats.
Curated OER
Checking County Numbers
Students use their county's information page to gather information about their community. Using the information, they create graphs from the tables provided and interpret the data. They write a paragraph showing their interpretation of...
Curated OER
The Stock Exchange Phase I
Second graders select a stock and follow its ups and downs, using graphs to show its success.
Curated OER
Heads-Up Probability
Second graders use tree diagrams to predict the possible outcomes of coin tosses. The data they collect and graph also help them predict the likelihood of getting heads or tails when tossing coins the next time.
Curated OER
Water Resources
Middle schoolers explore the differences between surface water and ground water. They collect data using maps and graphs and investigate a Texas river basin and a nearby aquifer. They complete a written report of their findings regarding...
Curated OER
What's Your Favorite Stuffed Animal?
Second graders gather information in a survey and interpret the results using a tally chart, a table, and a bar graph. They' present their results of the during the final group discussion. The subject of the survey is favorite stuffed...
Curated OER
The Demise of Copper's Trading Power
Eighth graders evaluate statistical equations. They examine data from archaeologists at Jamestown, complete statistical equations using the sets of data, and graph the results.
Curated OER
Home on the Biome
Fifth graders study six major biomes, graph temperature and rainfall, and present their findings to the class.
Curated OER
Technology Integration Lesson Plan: Music Database
Eighth graders gather information on fifteen of their favorite songs, create database with fields representing different attributes, explore and sort their databases, and create charts and graphs showing amount of play time vs. popularity.
Curated OER
Temperature and Altitude
Young scholars, after reading the explanation given below, use FoilSim to gather and record data on temperature and altitude generated by the FoilSim control panel.
Curated OER
Box Plots on the TI-83 Calculator
Eighth graders research box plots on the Internet. They gather real life statistics and analyze the collected statistics by making multiple box plots on the TI-83 calculator.
Curated OER
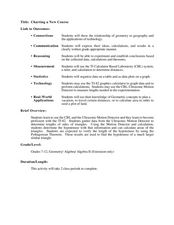
Charting a New Course
Students calculate the distance they will travel. In this geometry lesson, students use the TI and CBL system to make calculation of a certain path. They explore geography by calculating distances between different areas as it relates to...


