Curated OER
The Quadratic Formula
Students solve quadratic function by completing the square. In this algebra lesson, students use the quadratic formula to factor quadratics and find the roots. They graph the parabola and identify its properties.
Curated OER
How Do They Relate? Linear Relationship
Students collect information and use a line to represent it. In this algebra activity, students investigate real world data to see if it makes a line. They graph the line comparing the relationship of the x axis with that of...
Curated OER
"Real Life" Budgeting Project
Students experience what it is like to be a responsible citizen through a monthly budget through using a variety of research skills.
They apply collected data in a decision making exercise and
present the final product in a clear and...
Curated OER
Arrange the Classroom (Part 1 of 3)
Fifth graders arrange the classroom using all the moveable objects and through the exploration of area and perimeter. They determine the area of the classroom, create and label model pieces of furniture using graph paper, and create a...
Curated OER
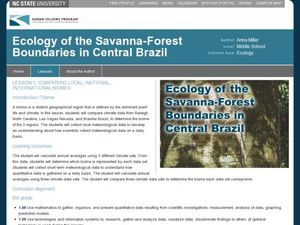
Comparing Local, National, International Biomes
Students calculate averages of climate sets of data. In this ecology lesson, students analyze data to determine identity of a biome and collect meteorological data to understand process. Students also compare data sets.
Curated OER
Comparison of Two Different Gender Sports Teams - Part 1 of 3 Measures of Central Tendency
Young scholars gather and analyze data from sports teams. In this measures of central tendency lesson, students gather information from websites about sports team performance. Young scholars analyze and draw conclusions from this data....
Curated OER
The Doctrine of Signatures
Students use the graphing calculator and the core equation: y=Ax^2+Bx+C where A = the acceleration of gravity/2, B = the initial velocity, and C = initial height above ground to graph parabolas for Earth and Mars. They experiment with...
Curated OER
Supermarket Smarts
Students examine how a consumer can make informed choices. They visit stores with a prepared shopping list, record the prices on a spreadsheet, create graphs, and create a Powerpoint presentation comparing the total cost of stores and a...
Curated OER
Natural Resources
Fifth graders begin the lesson by identifying the different types of natural resources. As a class, they discuss how environments are destructed and how the loss of one natural resource can affect the economy. Using a map, they label the...
Curated OER
Tracking Your Favorite Web Sites
Ninth graders track the hit count on their favorite web sites. In this Algebra I lesson, 9th graders record the number of hits on their favorite web site for twenty days. Students explore the data to determine if the relation...
Curated OER
Hit Me If You Can!
Students graph linear equations using slopes and intercepts. In this algebra lesson plan, students identify the slope as being positive,negative or undefined. They differentiate between different quadrants on a coordinate plane.
Curated OER
Eyewitnesses to Change
Students explore recent changes in the Artic's climate that have been observed by Artic residents. They watch videos, take notes and create a concept map. They also look at historical weather data from a specific Artic community. The...
Curated OER
Mystery Paint
Students use the scientific method to determine the properties of various kinds of paints, use collected data to identify paint samples that are not properly labeled and use proper science safety techniques while working with chemical...
Curated OER
Fractions and Fact Families: Jump Kangaroo Jump!
Second graders practice with fractions and fact families. In this fractions and fact families lesson, 2nd graders participate in a series of activities to assist them with understanding fractions. Activities include graphing,...
Curated OER
Leap Into Exponential Functions
Young scholars use properties of exponents to solve equations. In this algebra lesson, students add, subtract, multiply and divide exponential functions. They graph and differentiate between exponential growth and decay.
Curated OER
KEEP ON TRUCKING
Students comprehend and apply concepts of data analysis and distributions by observing modes of transportation for food and fiber products. They are given an activity sheet "On the Lookout for Agriculture." Students discuss the discuss...
Curated OER
What's Poppin'?
Second graders determine and compare weights and volumes of popped and unpopped corn to make predictions and solve problems. Students combine the data of each group into a graph. They construct questions, statements and story problems...
Curated OER
Marbles and Momentum
Students examine the law of conservation of momentum. In this physics lesson, students play marbles in order to compare the mass of the marble and velocities effects. Students receive directions of the marbles game and collect data while...
Curated OER
Rwanda: You Go, Girls
Students examine the genocide that took place in Rwanda in 1994 and focus the post-genocide success of women. They study websites to examine how women are challenging their traditional roles in Rwandan society.
Curated OER
Wsshington Monuments Projects
Eighth graders choose a landmark or monument to investigate (individually or with a partner). After agreeing on items to study they research the landmark/monument and prepare a presentation.
Curated OER
My Summer Vacation
Students study the United States geography using Google Earth. In this U.S. geography lesson, students create travel journals about five U.S. geographical locations. Students research the human and physical characteristics for each region.
Curated OER
Class Ketchup
Students describe statistics by conducting a class cooking activity. In this ketchup lesson, students conduct a class survey based on ketchup consumption habits by students. Students utilize tomatoes, water and a bottle to create their...
Curated OER
Creation and Interpretation of Voter Participation Graph
Ninth graders research information about voter participation in the United States based on age. They develop generalizations about voting patterns in the U.S and use Microsoft Excel to analyze the information.
Curated OER
I'm Inclined to See; Physics, Math, Science, Experiments, Graphs
Young scholars discover the motion of a sphere on an inclined plane and discover basic relationships involving distance, time, speed(velocity), and acceleration.


