Hi, what do you want to do?
Center for Innovation in Engineering and Science Education, Stevens Institute of Technology
Ciese: K 12 Education Curriculum: Online Classroom Projects
This site presents projects for individual classrooms and collaborative projects that can be done with other classes or schools. Most of these are science projects.
PBS
Pbs: El Nino
You can link to the anatomy of El Nino, chasing El Nino, and El Nino's reach. There is a resource page and a search page.
Wikimedia
Wikipedia: Bathyal Zone
Learn where this ocean zone is located, average temperature and the unique traits of the animals that reside there.
PBS
Quest: Evidence of Global Warming
Explore how rising sea levels and temperatures, increases in ocean heat, and melting glaciers support global warming in this interactive.
University Corporation for Atmospheric Research
Ucar: Make a Hurricane
The temperature of the sea, moisture in the air, and high winds all play a role in making a hurricane stronger or weaker. Drag the hurricane over the ocean to see what happens.
University of California
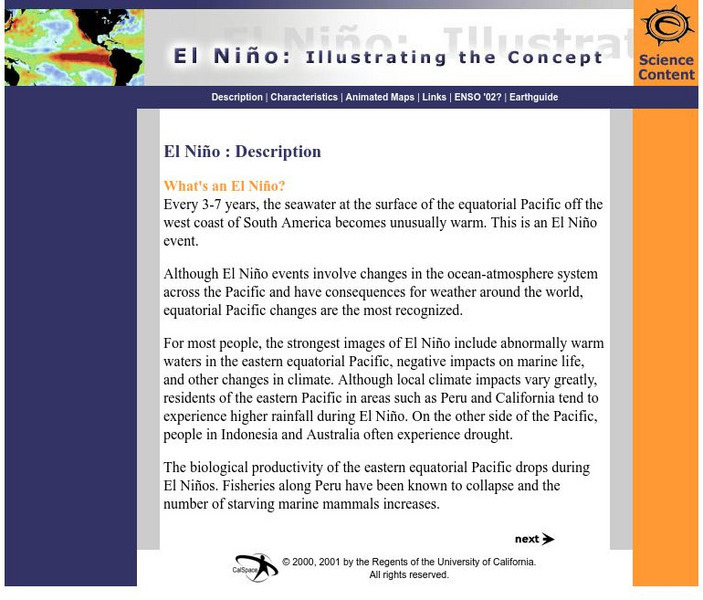
Earthguide: El Nino: Illustrating the Concept
Do you know what happens during a typical El Nino? This overview provides a description, characteristics, and animated maps showing sea surface temperature changes during past El Nino events.
PBS
Pbs Teachers: Whale Watcher Game Lesson
Describe the gray whale migration route and graph reasons for the migration. Predict what would happen to gray whales if they did not exhibit certain behaviors. This site also contains an interactive game.
University Corporation for Atmospheric Research
Ucar: Sea Ice and Heat: A Vicious Cycle
Melting sea ice doesn't cause sea level to rise because the ice is already in the ocean, but it does cause other changes to the planet. When sea ice melts, more sunlight is absorbed by the Earth, which causes more warming. It's a vicious...
NOAA
Noaa: Cpc: Weekly Enso Update
Weekly updates on data collected and analyzed by the Climate Prediction Center. Includes sea surface temperature, subsurface tropical Pacific analyses and much more. Extensive site: check it out!
Other
Teaching Heart: Penguins
Use this site if you want to find ideas, lessons and activities related to penguins.
Curated OER
Coral Reef
Discover more about the underocean environment at this site that surveys animals, environmental factors such as light and temperature, currents, animals, plants, and the like.
NOAA
Noaa: Photo Library: Solar Powered Surface Automated Measurement (Sam) Site
The National Oceanic and Atmospheric Administration provides a photo library of severe weather formations and the instruments that measure them. Here you can find a photograph of a solar-powered Surface Automated Measurement (SAM) site....
NOAA
Noaa: National Oceanographic Data Center: Home Page
The National Oceanographic Data Center archives and provides public access to global oceanographic and coastal data, products, and information. Fantastic research data.
Alabama Learning Exchange
Alex: What's Wrong With Global Climate Change?
Students will identify factors that affect the solubility of a salt and test one of the factors (temperature). They will apply their experience to ocean salinity, the effects of temperature on the composition of ocean water, and what...
BioEd Online
Bio Ed Online: The Water Cycle and Global Warming
For this lesson plan, students will trace the flow of water in the environment, investigate simulated effects of global temperature change on oceanic levels, evaluate changes within the water cycle, and explain several different...
Idaho State University
Global Wind Systems [Pdf]
A great description of the global scale circulation and heat energy. Discusses a single-cell model, a three-cell model, jet streams and more.
BBC
Bbc: News: Guide to Climate Change
The BBC offers an interactive guide to climate change, including a sliding scale depicting climate change from 1885 to 2099, animation which explores how the greenhouse effect works, and detailed diagrams exploring the carbon cycle, the...
Other
Hub Pages: Abiotic Factors: A Component of Ecosystem
In the environment, there are external factors that really affect organisms living within it. One of these factors is the set of abiotic factors, or nonliving variables, such as wind, ocean, day length, rainfall, temperature, and ocean...
Curated OER
Educational Technology Clearinghouse: Maps Etc: North America, 1868
A map from 1868 of North America, Central America, and the Caribbean showing the physical features of the region, vegetation types, ocean currents, temperatures, principal products and mineral deposits. Mountain chains are represented by...
Curated OER
Educational Technology Clearinghouse: Maps Etc: South America (Physical), 1868
A map from 1868 of South America showing the physical features of the region, vegetation types, ocean currents, temperatures, principal products and mineral deposits. Mountain chains are represented by lines of varying thickness, with...
Curated OER
Educational Technology Clearinghouse: Maps Etc: Winter Monsoon in India, 1910
A map from 1910 of the Indian subcontinent and the Central Asia region showing the typical rainfall distribution patterns during the winter monsoons, keyed to show areas of rainfall ranging from very light to heavy rainfall. The map...
Curated OER
Educational Technology Clearinghouse: Maps Etc: Summer Monsoon in India, 1910
A map from 1910 of the Indian subcontinent and the Central Asia region showing the typical rainfall distribution patterns during the summer monsoons, keyed to show areas of rainfall ranging from very light to, according to this text, the...
Curated OER
Etc: Maps Etc: Heat Belts in North America, 1898
A map from 1898 showing the heat belts in North America. The map gives the boundary isotherms of the hot belt as a mean temperature of 70 degrees Fahrenheit and the cold belt as a mean temperature of 30 degrees Fahrenheit, indicating the...
Curated OER
Educational Technology Clearinghouse: Maps Etc: Isothermal Map of Europe, 1916
An isothermal map of Europe from 1916 showing the average temperature ranges on the continent, illustrating how the westerly winds bring the temperatures of the ocean far inland. The isotherms show lines of equal temperature in degrees...


