Cherry Creek Schools
Physical Science Final Exam Review Packet
If you need a way to assess the concepts in your physical science class, use an extended set of worksheets as a midterm or final exam. It includes questions about density, physical and chemical matter, speed and velocity, weight and...
Curated OER
Frost Depth Study
Learners complete activities to study the frost and frost depth. In this frost study lesson, students use frost tubes to study and measure the frost at their school. Learners measure the frost in the tube and enter their data online to...
Curated OER
Veggie Chop and Data Analysis
First graders chop vegetables into fractions. In this fractions lesson, 1st graders cut vegetables, collect data about favorite vegetables and create a bar graph using the information. Students make inferences about the data and...
Curated OER
Stick-Slip Movement
Ninth graders operate a model to observe the type of motion that occurs at a fault during an earthquake. They explore the effects of several variables. Students measure movement, calculate averages and plot and graph information.
Curated OER
Backyard Critters
Students explore the characteristics of invertebrates in their backyards. They observe, describe, and classify specimens. They conclude with a "snail race."
Curated OER
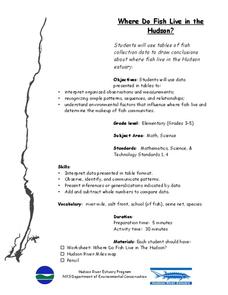
Where Do Fish Live in the Hudson?
Students explore the environmental factors that influence where fish live and determine the makeup of fish communities in the Hudson. They interpret guided observations and measurements to assess patterns, sequences and relationships.
Curated OER
Blowing in the Wind
Students compare hurricanes and tornadoes. They write a paragraph explaining how to prepare for a storm. Students give an oral report. They use weather facts to practice math skills. Students record observations of a storm.
Curated OER
Fish Communities in the Hudson
Learning to read data tables is an important skill. Use this resource for your third, fourth, or fifth graders. Learners will will study tables of fish collection data to draw conclusions. The data is based on fish environments in the...
Curated OER
Basic Excel
Learners explore basic Excel spreadsheets. In this spreadsheet lesson plan, students enter Alaska weather information and perform calculations. Learners title the columns on the spreadsheet and format the cells. ...
Pyro Innovations
Get into Shape
Shapes are so fun! Little ones explore, identify, and create shapes using tangrams or pattern blocks. The activity is intended to stimulate critical thinking while engaging learners through play and shape identification. Each child will...
Curated OER
Cross Cultural Transportation and Resources Exchange
Students examine various modes of transportation. They explore regional transportation options and discover options available in their area. Students survey types of transportation people use in their area. Using spreadsheet data,...
NTTI
Vectors: Traveling, But in What Direction
High schoolers watch a video of real-world situations regarding speed, direction, velocity, force, etc. and answer questions while viewing. They then practice drawing and using vectors to solve more real-world problems.
Curated OER
Data Analysis
Young statisticians use and interpret measures of center and spread such as mean, median, and mode as well as range. They use box plots to represent their data and answer questions regarding the correspondence between data sets and the...
Curated OER
Multi-dimensional Modeling of Ore Bodies Making Sense of Empirical Data
Math scholars identify four different rock types in that strata and use this identification and data to construct a two dimensional geologic cross-section. They use data tables to construct a three-dimensional geologic cross-section.
Curated OER
Discovering a Law of Space Physics
Students use data collected by an astronomer to determine the relationship between the time it takes the planet to orbit the sun and the average radius of the planet's orbit around the sun. Students use trial and error to find the...
Curated OER
Zoom Out
Students explore visual perception and how objects change as distance changes. In this distance and vision lesson, students practice their scientific inquiry skills. Students practice drawing objects from different points of view in...
Curated OER
How Oceans Affect Climate
Learners draw conclusions about how the ocean affects temperature. In this weather lesson, students use the Internet to gather data to help them come to a conclusion about how the climate in a certain region is directly affected by the...
Curated OER
Altitude to the Hypotenuse
Can your class solve right triangles and identify the properties common to right triangles? They will investigate and state the relationship between the altitude to the hypotenuse and the two segments of the hypotenuse formed by the...
Curated OER
Excel temperature Graphs
Students gather data about the weather in Nome, Alaska. In this Nome Temperature lesson, students create an excel graph to explore the weather trends in Nome. Students will find the average weather and add a trend line to their graph.
Curated OER
Sea Ice Board Game
Students understand the sea ice cycle and can explain its stages. In this Sea Ice lesson, students play a game to identify types of sea ice. Students answer critical thinking questions about sea ice. Students complete a sea ice worksheet.
Curated OER
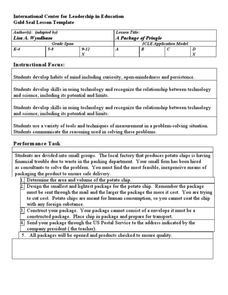
A Package of Pringle
Here is a problem-solving instructional activity that has learners take the role of a packaging expert to design an inexpensive means of packaging a potato chip. It could benefit from having more specific detail about the instructional...
Curated OER
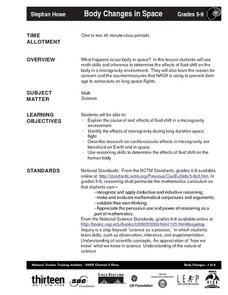
Body Changes in Space
Students explain the cause of and effects of fluid shift in a microgravity
environment. Students identify the effects of microgravity during long duration space flight. Students describe research on cardiovascular effects in microgravity...
Curated OER
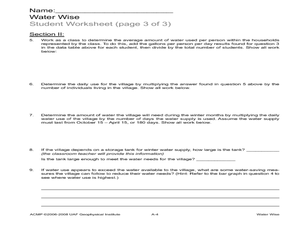
Water Wise
Students calculate their family's water consumption. In this water usage lesson, students discuss the water they use in their homes. Students complete the 'water wise' worksheets to tally their family's use of water. Students answer...
Curated OER
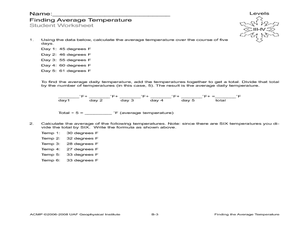
Finding the Average Temperature
Students calculate averages. In this average temperature lesson, students collect data and use their problem solving skills to calculate average temperatures.


