Curated OER
Reading Line Graphs
In this line graphs learning exercise, 4th graders, after studying a line graph illustrating Emily's hiking record, answer 4 short answer questions relating to the line graph.
Curated OER
Graph Paper Patterns
Young artists divide a piece of graph paper into sections using rectangles, squares, and triangles. They then fill each section with patterns of shape and color. Elementary graders describe how their patterns are organized. Secondary...
Pennsylvania Department of Education
Equal Groups
Students explore statistics by completing a graphing activity. In this data analysis instructional activity, students define a list of mathematical vocabulary terms before unpacking a box of raisins. Students utilize the raisins to plot...
Curated OER
Cricket Weather
In this collecting data learning exercise, 4th graders use the data collected on crickets chirps and the temperature to make a line graph by following 4 directives.
Curated OER
Line and Pattern
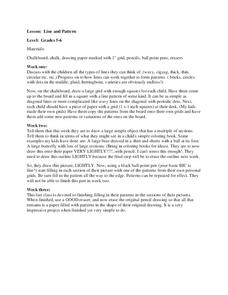
Students investigate lines and patterns. In this line and pattern lesson, students discuss types of lines and work on grids. They draw a picture very lightly before filling it in with the pattern they made in the grid.
Curated OER
"Graph It"
Young scholars work in teams to conduct short surveys of their classmates. They show their results using at least two different types of graphs.
Students separate into teams and are asked that each team to choose something that they are...
Curated OER
Misleading Graphs
Students explore number relationships by participating in a data collection activity. In this statistics lesson, students participate in a role-play activitiy in which they own a scrap material storefront that must replenish its...
Curated OER
Graphing X, Y, Z
Seventh graders explore how proportion controls the image of a drawing. They examine a coordinate plane and discuss plotting. Student experiment drawing an object one size, and then drawing an identical object on a different scale.
Curated OER
Rise Over Run
Students define the slope of the line, find the slope between any two points on the line, and allow them to name other areas where the slope is used. They explain why the slope is defined as the rise over the run.
Curated OER
Animal Runners
In this collecting data worksheet, 4th graders use the data shown on how fast 6 animals can run to create a bar graph. Students follow the instructions on 3 directives for their bar graphs and answer 1 short answer question.
Curated OER
Sunshine Math 3
In this word problems worksheet, learners read and problem solve nine mathematical word problems involving grids, measurement, compensation and angles.
Curated OER
Make a Graph
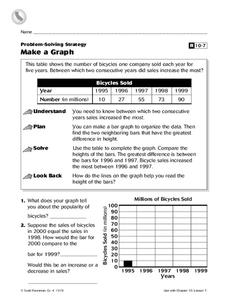
In this graphs worksheet, 4th graders, after studying and analyzing a table on bicycles sold within several years, answer 2 short answer questions relating to the table.
Curated OER
Hot and Cold Colors
Students experiment with the color and solar energy absorption. In this color and solar energy absorption lesson, students spend two days discussing and experimenting with the concept of energy absorption. They paint cans with different...
Curated OER
Shaky New Zealand
Students explore geography by answering study questions in class. In this plate tectonics lesson, students identify the earthquake data concerning the country of New Zealand and answer questions regarding the data. Students identify...
J. Paul Getty Trust
Tag: Whose Values
Get young people thinking about their lives and current topics of social justice, advocacy, gender, race, and identity. After examining several works by Barbara Kruger, participants select a tag with one of the questions printed on it,...
Curated OER
Interpreting Medical Data
Students explore human anatomy by graphing scientific data. In this vision lesson, students discuss how ophthalmology works and take their own eye assessment test using the Snellen chart. Students collect vision data from all of their...
Curated OER
Graphing Grazy Crayons
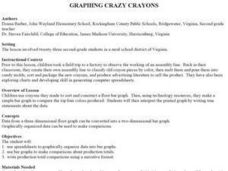
Children create crazy crayons they made to sort and construct a floor bar graph. Then, using technology resources, they make a simple bar graph to compare the top four colors produced. Students will then interpret the printed graph by...
Curated OER
15 Two-Block Quilts
Young scholars create two block quilts after studying about continuity of lines, use of coloring, and highlighting adjacent pieces. Students complete the design into the border. Young scholars cut the required material pieces to create...
Curated OER
Parts of Art
Young scholars define and use new vocabulary associated with the elements of art. As a class, they brainstorm different ways in which we communicate with one another. In groups, they view different pieces of art from the Native American...
Curated OER
The Ups and Downs of don Pasquale: Mapping the Emotional Journey of Characters in Don Pasquale
Students listen to and retell the story of Don Pasquale. They evaluate the emotions of the main characters. Students create a graph of the emotions of Don Pasquale.
Curated OER
Theobroma - Food of the Gods
Students discuss the history of cacao and its use in the production of chocolate. They analyze actual cacao pods and record their observations. Finally they create a five minute contour drawing of the cacao pod and seeds.
Curated OER
ART PROJECT
Eighth graders, after researching the properties of graphs of conic sections, absolute value and inverse relations, make a drawing of precise functions and relations from a specified list of equations. The final design should analyze the...
Curated OER
Shaky New Zealand
Students explore Earth science by building a model in class. In this tectonic plate lesson, students identify the impact tectonic shifts have on humans and animals and where the plates and faults lie under New Zealand. Students examine...
Curated OER
Transforming Triangles
Sixth graders graph translations (slides) and reflections (flips) on a coordinate plane. They visualize and identify geometric shapes after applying transformations on a coordinate plane. Finally, 6th graders write a paragraph telling...


