Curated OER
Graphing and the Coordinate Plane
Students learn about the Cartesian coordinate plane, understand the four quadrants of the Cartesian coordinate plane, and plot points on the plane. Students read coordinates for a point from a graph and give the ratio of rise over run...
Curated OER
Reading Graphs
Pupils practice plotting functions on the Cartesian coordinate plane, see several categories of functions, including lines and parabolas, and read a graph, answering questions about the situation described by the graph
Curated OER
Reading Graphs
Learners plot functions on the Cartesian coordinate plane. They explore lines and parabolas. Students analyze graphs and answer questions about the information presented on the graph using an online program.
Curated OER
My Peanut Butter is Better Than Yours!
Learners explore the concept of statistical data. In this statistical data lesson, students read an article about the dangers of peanut butter to those who are allergic. Learners perform a taste test of two different brands of peanut...
Alabama Learning Exchange
The State Capital of Stem and Leaf
Young scholars explore the concept of stem and leaf plots. In this stem and leaf plots lesson, students plot the 50 US states' capitals on a stem and leaf plot according to the first letter of each state. Young scholars...
Curated OER
The Mandelbrot Set
Students are introduced to the notion of a complex number and function iteration in order to motivate the discussion of Julia sets and the Mandelbrot set.
Curated OER
Between The Extremes
Students analyze graphs for specific properties. In this algebra lesson, students solve equations and graph using the TI calculator. They find the different changes that occur in each graph,including maximum and minimum.
Curated OER
Investing
Students collect data on investments and draw conclusions. In this algebra lesson, students analyze exponential graphs as they relate to money. They discuss the cause of an account balance being high or low.
Curated OER
The Mandelbrot Set
Students explore the Mandelbrot Set. They are introduced to the concept of a complex number and function in order to motivate the discussion of Julia and Mandelbrot sets. Students investigate fractals and how they are built.
Curated OER
Modeling With Circular Functions
Students explore circular functions. They identify the amplitude, period, phase shift and vertical shift of circular functions. Students analyze phenomena described by sine waves and they find mathematical models for transforming images...
Curated OER
Impossible Graphs
Students distinguish between possible and impossible graphs of functions, and to learn why some graphs are impossible. They have practiced plotting functions on the Cartesian coordinate plane
Curated OER
The Quadratic Formula
Students solve quadratic function by completing the square. In this algebra lesson, students use the quadratic formula to factor quadratics and find the roots. They graph the parabola and identify its properties.
Curated OER
Confusing Colors!
Fourth graders collect data, graph their data, and then make predictions based upon their findings. They's interest is maintained by the interesting way the data is collected. The data collection experiment is from the psychology work of...
CK-12 Foundation
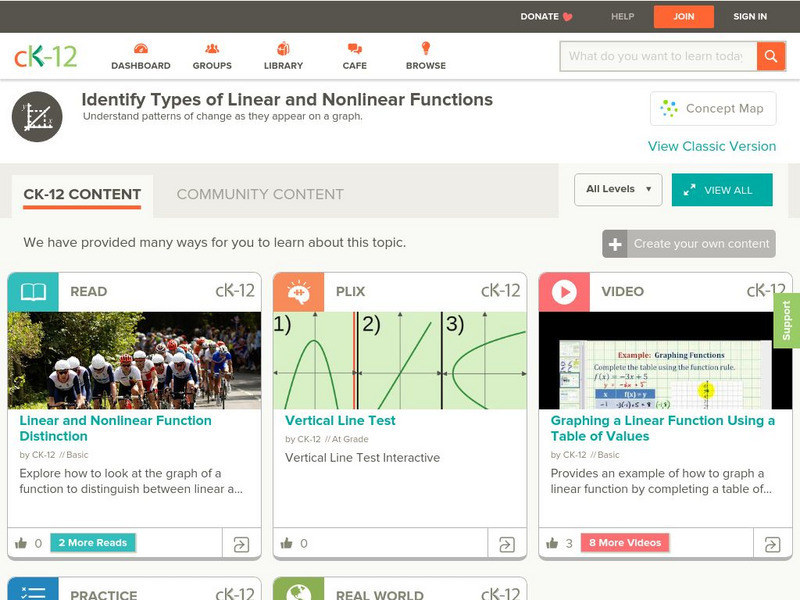
Ck 12: Algebra: Linear and Non Linear Patterns of Change
[Free Registration/Login may be required to access all resource tools.] Model and solve real-world problems involving patterns of change
Texas Instruments
Texas Instruments: Mc Dougal Littell Mid. School Math: Graph Non Linear Functions
Students will compare functions by graphing the functions and describing the patterns in the graphs.
Texas Instruments
Texas Instruments: A Penny Saved Is a Penny Earned
Students investigate exponential growth in powers of 2 and discover patterns in their sums.


