Astronomical Society of the Pacific
Getting Ready for the All American Eclipse!
Give your pupils a front row seat at the biggest light show in the sky this year! In addition to admiring the total solar eclipse, young astronomers can explain the phenomenon with a little help from an inquiry-based instructional...
Core Knowledge Foundation
Weather or Not, Seasons Change
Embark on a year long investigation of the seasons with this 10-lesson earth science unit. After being introduced to different types of weather and the tools used to measure it, young scientists perform fun hands-on activities that...
Curated OER
Clip the Face
Middle schoolers discover the moon's phases and the rarity of eclipses. In this lunar lesson, students view a video titled Spin Around the Solar System: A Moon Dance, which demonstrates the key differences between a lunar and solar...
Curated OER
Mars Calendar Project
Young scholars design a calendar that displays time on Mars. They explore the differences between time on Earth and time on Mars while making the calendar.
Curated OER
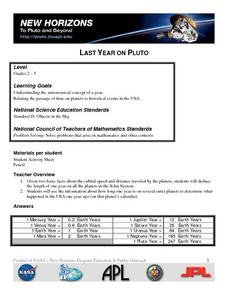
Last Year on Pluto
Students examine the astronomical concept of a year. They relate the passage of time on planets to historical events in the USA.
Curated OER
World Environment Day
In this World Environment Day worksheet, learners complete activities such as reading a passage, phrase matching, fill in the blanks, correct words, multiple choice, spelling sequencing, scrambled sentences, asking questions, take a...
Curated OER
Agriculture Day
In this Agriculture Day learning exercise, students complete activities such as reading a passage, phrase matching, fill in the blanks, correct words, multiple choice, spelling, sequencing, scrambled sentences, writing questions, survey,...
Curated OER
What is Weather?
Students identify different types of weather and explore the weather for each season of the year. They complete a class seasonal weather chart, listen to the book "Oh Say Can You Say What's the Weather Today?," and create a magazine...
Curated OER
PATTERNS IN TIME
Students build a realistic sense of geological time, seek clues of transition fossils and find them. In this investigative lesson plan students complete several activities and worksheets on fossils.
Curated OER
Happy Birthday Mathematicians and Me
Students choose a mathematician or scientist born on the same day as the student and research them. They create a cube or tetrahedron and place required information on the sides (such as birth year, death yr., greatest contribution to...
Curated OER
Glaciers Leave Their Imprint
Pupils study various types of glaciers and the landforms they create. Working in pairs, they research a type of glacial landform and construct a calendar page illustrating and describing it. The pages be compiled to create a class calendar.
Curated OER
Let's Think About... Change
Students observe various examples of "change." They mix paint to cereate new colors, eat bread and then toasted bread, and match baby pictures with pictures of how the same people look in the present. Finally, they watch a bouquet of...
Curated OER
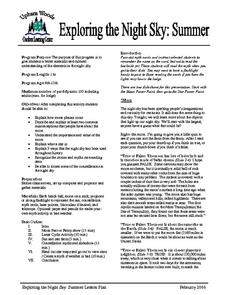
Exploring the Night Sky: Summer
Learners explain how moon phases occur. They describe and explain at least two common misconceptions that people have about the moon. Students explain what a star is. They explain 3 ways that the night sky has been used throughout history.
Curated OER
Database
Second graders collect daily weather information and introduce them to databases.
Curated OER
Patterns In Time
Seventh graders examine fossils. In this vertebrate fossils lesson students view a demonstration.
Curated OER
Exploring the Night Sky: Fall/Winter
Students explain how moon phases occur. They explain three ways that the night sky has been used through history. Students locate some of the constellations in the night sky. They discuss stories and myths surrounding stars.
Curated OER
DASH Sunrise and Sunset/ Seasons Chart
Second graders rotate as the person to enter the information of sunrise and sunset into a spreadsheet. The teacher also demonstrates how to convert the spreadsheet into a chart.


