Hi, what do you want to do?
Stefan Warner and Steven R. Costenoble
Finite Mathematics & Applied Calculus: Quadratic Functions and Models
The resource investigates quadratic functions and models. Students learn about the concepts through notes and examples. A chapter quiz, review exercises, and chapter summary are included.
J Coffman
Joseph Coffman's Lecture Notes: Modeling Data With Quadratics
Learners explore quadratic functions and their graphs. Vocabulary, examples, methods, and a quiz are included.
Other
Desmos: Modeling Bundle
A collection of activities where students investigate mathematical modeling. Activities involve different types of functions, how to examine context and decide on a model, and limitations.
CK-12 Foundation
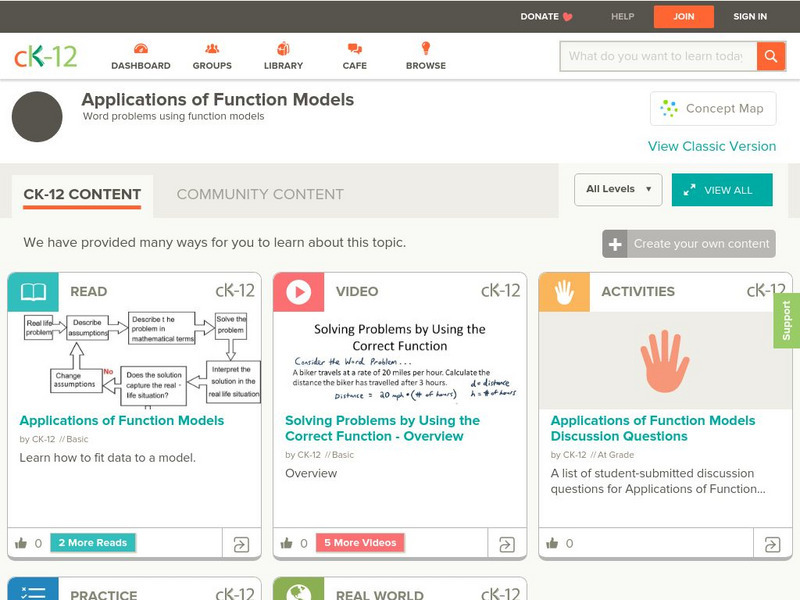
Ck 12: Applications of Function Models
[Free Registration/Login may be required to access all resource tools.] A collection of resources for exploring word problems using function models.
CK-12 Foundation
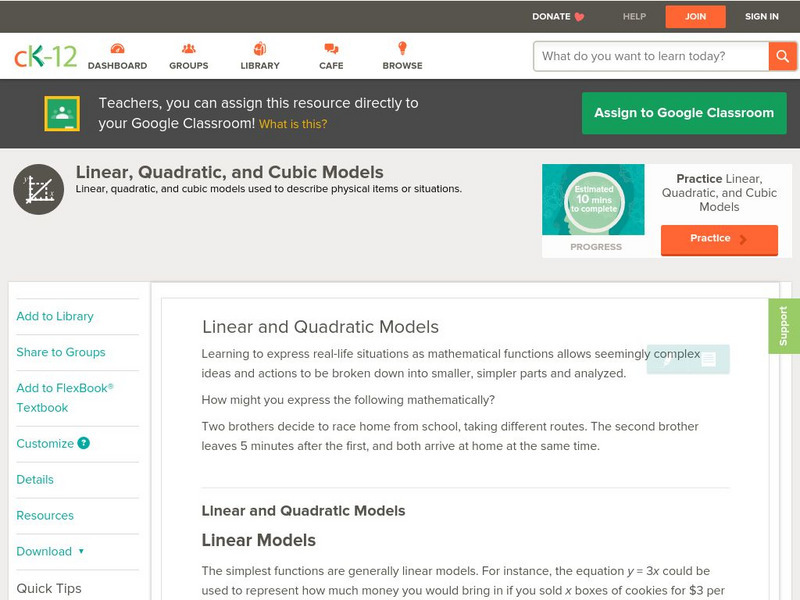
Ck 12: Analysis: Linear and Quadratic Models
[Free Registration/Login may be required to access all resource tools.] Modeling of Linear and Quadratic Functions
Texas Instruments
Texas Instruments: Floral Shop Math
Students will create quadratic functions that model revenue collected and profit earned from selling bouquets in a flower shop. The students can use graphing calculators to identify the maximum value for each function. Once they identify...
Khan Academy
Khan: Lsn 12: Exponential Functions, Equations, Expressions and Radicals
Lesson 2 of 4 for Passport to Advanced Math. Learners will build quadratic and exponential functions that model a given context; solve radical equations; work with rational expressions, including fractions with a variable in the...
Stefan Warner and Steven R. Costenoble
Finite Mathematics & Applied Calculus: Topic Summaries: Non Linear Functions and Models
The topic summary outlines non-linear functions and models. Some topics reviewed are quadratic functions, exponential functions, logistic functions, and logarithms. The resource consists of definitions, notes, and examples.
Texas Instruments
Texas Instruments: Math Today Challenge Heat Watch
Students will explore linear & quadratic functions to determine how they model the relationship between air temperature & heat index. Once the models are determined students will make predictions about heat index when given a...
CK-12 Foundation
Ck 12: Algebra: Applications of Function Models
[Free Registration/Login may be required to access all resource tools.] In this lesson students draw a scatter plot of data, find and draw the function that best fits that data, and make predictions from that information. Students watch...
Texas Instruments
Texas Instruments: Ball Bounce
This activity allows students to use real data obtained by them to model quadratic equations. students can use the TI-83 and/or TI-84 and a motion detector to collect their data. The students will then manually fit both quadratic and...
Texas Instruments
Texas Instruments: Math Today for Ti Navigator System Humidity Makes Air Feel
Using data from the USA TODAY graphic,"Humidity makes air feel even hotter," students will explore quadratic and cubic functions to determine how well they model the relationship between air temperature and heat index. When the models...
Math Graphs
Houghton Mifflin: Math Graphs: Fitting Models to Scatter Plots 1 [Pdf]
Students use a scatter plot to determine whether data can be modeled by a linear function, a quadratic function, a trigonometric function, or that there appears to be no relationship between x and y. The resource consists of an enlarged...
Math Graphs
Houghton Mifflin: Math Graphs: Fitting Models to Scatter Plots 2 [Pdf]
Students use a scatter plot to determine whether data can be modeled by a linear function, a quadratic function, a trigonometric function, or that there appears to be no relationship between x and y. The resource consists of an enlarged...
Math Graphs
Houghton Mifflin: Math Graphs: Fitting Models to Scatter Plots 3 [Pdf]
Students use a scatter plot to determine whether data can be modeled by a linear function, a quadratic function, a trigonometric function, or that there appears to be no relationship between x and y. The resource consists of an enlarged...
Math Graphs
Houghton Mifflin: Math Graphs: Fitting Models to Scatter Plots 4 [Pdf]
Students use a scatter plot to determine whether data can be modeled by a linear function, a quadratic function, a trigonometric function, or that there appears to be no relationship between x and y. The resource consists of an enlarged...
Alabama Learning Exchange
Alex: Discover the Roots of a Polynomial Function
In this lesson, students will be re-introduced to the Four Step Problem - Solving Plan. The plan will be used as a 'checks and balance' tool for discovering the roots (solutions) of polynomial functions. Students will: *Explore the...
Student Achievement Partners
Student Achievement Partners: Penny Circle Task [Pdf]
Students will explpre models and understand the difference between quadratic, exponential, and linear models in this lesson plan.
CK-12 Foundation
Ck 12: Analysis: Logarithmic Functions
[Free Registration/Login may be required to access all resource tools.] Evaluating logarithmic functions by comparing to exponential functions and rewriting to solve.
Texas Instruments
Texas Instruments: Ratio of Areas
In this activity, students use the CellSheet Application to determine geometric ratios of areas. Students determine the position of the vertices of a square that has all four vertices on the sides of a larger square and has a specified...
Richland Community College
Richland Community College: Math 116 Lecture Notes
This site from the Richland Community College provides the detailed lecture notes to a college algebra course, complete with equations and definitions. Content ranges from "functions and their graphs" to "conics and parametric equations."
Math Graphs
Houghton Mifflin: Math Graphs: Fitting Models to Scatter Plots 7 [Pdf]
Learners use a given scatter plot to identify whether the data can be modeled by a linear, quadratic, or trigonometric function. The math graph is available in PDF format.
Math Graphs
Houghton Mifflin: Math Graphs: Fitting Models to Scatter Plots 8 [Pdf]
Learners use a scatter plot to identify whether the data can be modeled by a linear, quadratic, or trigonometric function. The math graph is available in PDF format.
Texas Instruments
Texas Instruments: What Goes Up: Position and Time for a Cart on a Ramp
In this activity, students' will use a motion detector to measure how the position of a cart on a ramp changes with time. They will then determine a parabolic model for the position data using the intercepts.


