Curated OER
Excel temperature Graphs
Students gather data about the weather in Nome, Alaska. In this Nome Temperature lesson, students create an excel graph to explore the weather trends in Nome. Students will find the average weather and add a trend line to their graph.
Curated OER
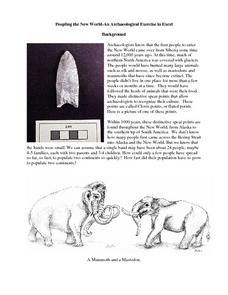
Peopling the New World -- An Archaeological Exercise in Excel
Middle schoolers examine different types of spears that have been discovered from various civilizations. In groups, they calculate the answers to various word problems and enter their information on a spreadsheet. They use the data in...
Curated OER
Do Vampires Really Exist?
Students identify and extend a number pattern into very large values. They create and interpret a graph based on their number patterns. Students compare a math model with real-world statistics about the existence of vampires.
National Council of Teachers of Mathematics
National Debt and Wars
Take a functional approach to the national debt. Learners collect information about the national debt by decade and plot the data. They determine whether an exponential curve is a good fit for the data by comparing the percent changes...
Curated OER
Beisbol! Latino Baseball Pioneers and Legends
Students explore Latin America by researching the favorite past time, baseball. In this Latin culture instructional activity, students identify the leaders in the Latin American baseball movement such as Felipe Alou, Jose Mendze, and the...


