Curated OER
Creating a Mathematical Model Using Weather Data
Students explore the concept of mathematical models. In this mathematical model lesson, students create a mathematical model from data from 4 cities over 15 months. Students are told they are working for a weather station. Students...
Curated OER
Integers in the Weather
Middle schoolers engage in a clever lesson that combines meteorology with mathematical thinking. They use integers in relation to high and low temperatures that they record. They use a spreadsheet of weather data, a computer, and gain...
Curated OER
Infrared-Hot
Students describe how the sun heats the Earth, explain the nature of infrared light, explain how thunderstorms are formed and use infrared maps to predict severe weather.
Curated OER
Data Analysis and Measurement: Ahead, Above the Clouds
Students explore and discuss hurricanes, and examine how meteorologists, weather officers, and NASA researchers use measurement and data analysis to predict severe weather. They plot points on coordinate map, classify hurricanes...
Curated OER
Activities to Enhance STEDII Data
Students develop an understanding of related weather processes such as wind, cloud cover, and temperature using STEDII data and instrumentation. In addition, they integrate mathematical calculations to produce a forecast map.
Curated OER
Weather Report Chart
Students complete a weather report chart after studying weather patterns for a period of time. In this weather report lesson, students measure temperature, precipitation, cloud cover, wind speed, and wind direction for a month. Students...
NASA
The Case of the Wacky Water Cycle
Join the tree house detectives in learning about the processes of the water cycle, water conservation, water treatment, and water as a limited resource.
Illustrative Mathematics
Weather Graph Data
Teaching young mathematicians about collecting and analyzing data allows for a variety of fun and engaging activities. Here, children observe the weather every day for a month, recording their observations in the form of a bar graph....
Curated OER
Right Place, Right Time
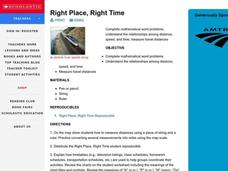
Fourth graders complete mathematical word problems. They study the relationships among distance, speed, and time; and measure travel distances. They measure distances using a piece of string and a ruler and practice converting several...
Curated OER
Mean, Median and Mode
Fourth graders describe weather data using the mean, median and mode. In this mean, median and mode lesson, 4th graders understand how to calculate data using mean, median and mode and why they would use each one.
Curated OER
Tracking the Storm
Students discuss the different types of storms that can hit land. They locate specific coordinates on a plane grid. They discuss lonsgitude and latitude to plot the coordinates of a tropical storm. They practice finding coordinates...
Curated OER
Global Warming Statistics
Students research real-time and historic temperature data of U.S. and world locations, and analyze the data using mean, median, and mode averages. They graph the data and draw conclusions by analyzing the data. A spreadsheet is used to...
Curated OER
Probability Experiment
Students do an experiment with probability. In this probability lesson, they listen to part of the book G is for Googol: A Math Alphabet Book by David M. Schwartz. They complete 3 probability experiments and check to see how close their...
Curated OER
Graphing and Analyzing Biome Data
Students explore biome data. In this world geography and weather data analysis lesson, students record data about weather conditions in North Carolina, Las Vegas, and Brazil. Students convert Fahrenheit degrees to Celsius degrees and use...
Curated OER
Water in the Texas Coastal Basins
Students, after researching a Texas coastal basin, map and graph the information they collect and then translate it into a short report to be presented to their classmates. They brainstorm unique ways to maintain Texas estuaries as well...
Curated OER
Water: On the Surface and in the Ground
Learners explore the differences between surface water and ground water. They collect data using maps and graphs and investigate a Texas river basin and a nearby aquifer. They complete a written report including maps and data regarding...


