Hi, what do you want to do?
Calculator Soup
Calculator Soup: Descriptive Statistics Calculator
This is a statistics calculator; enter a data set and hit calculate. Descriptive statistics summarize certain aspects of a data set or a population using numeric calculations. Examples of descriptive statistics include: mean, average,...
Math Aids
Math Aids: Mean Mode Median Worksheets
Great resource to practice and strengthen math skills pertaining to mean, mode, and median. Math worksheets are printable, may be customized, and include answer keys.
Shodor Education Foundation
Shodor Interactivate: Lesson: Stem and Leaf Plots
Lesson plan introduces students to stem-and-leaf plots. Many resources are available for student and teachers here.
Other
Nmu: Box and Whisker Plot Instructions
Site discusses the use of box-and-whisker plots. An example is presented and completely worked through, so that the user can see the results of the calculations after the steps have been explained.
Houghton Mifflin Harcourt
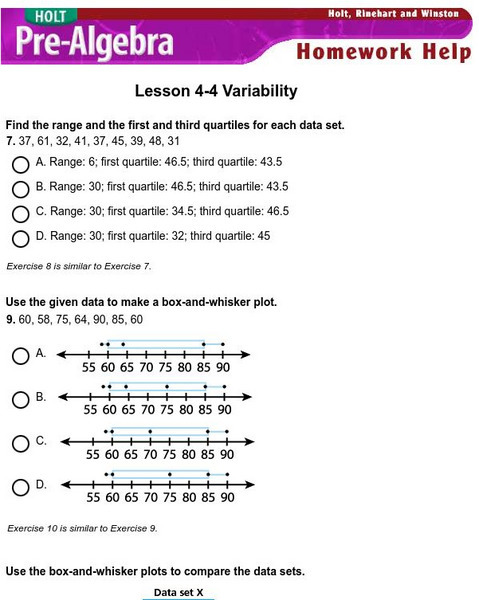
Holt, Rinehart and Winston: Homework Help Independent Practice: Variability
Get independent practice working with variability. Each incorrect response gets a text box explanation and another try. Correct responses are confirmed.
Missouri State University
Missouri State University: Introductory Statistics: Statistics
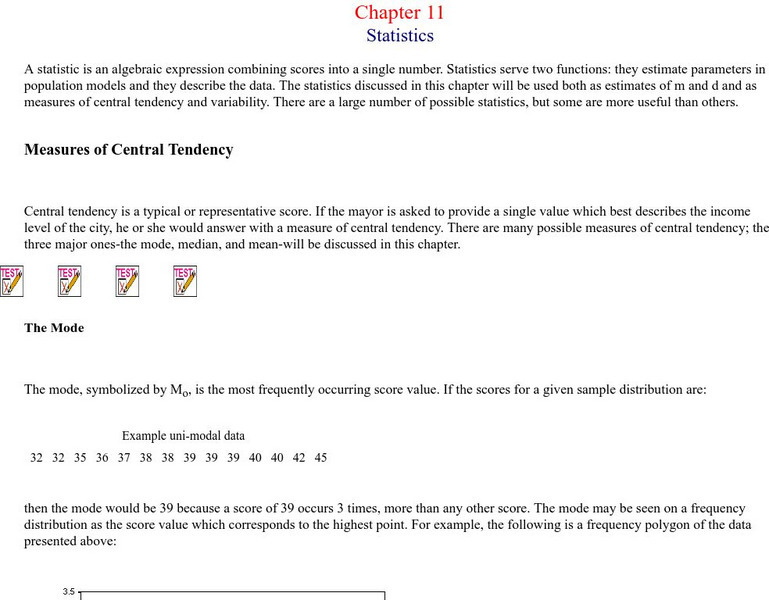
This is an excellent resource on what the science of statistics involves. There are all kinds of definitions, examples, graphs, and charts to learn from. The topics covered include: mode, mean, median, skewed distributions and measures...
Other
Csulb: Stem: How Much Water Fits on a Penny? [Pdf]
Students explore mean, median, mode, and range with this hands on activity.
Alabama Learning Exchange
Alex: My Peanut Butter Is Better Than Yours!
The students will engage in the process of statistical data comparing data using tables and scatterplots. The students will compare data using measures of center (mean and median) and measures of spread (range). This lesson can be done...
Calculator Soup
Calculator Soup: Mean, Median, Mode Calculator
Calculate mean, median, mode along with the minimum, maximum, range, count, and sum for a set of data.
Other
Meta Calculator: Statistics Calculator
A web-based statistics calculator to find mean, median, standard deviation, variance and ranges.
Other
James Wright: Measures of Central Tendency
This site looks at measures of central tendency and dispersion. Discussed are topics such as standard deviation, mean, median, and mode.
Concord Consortium
Seeing Math: Plop It
Plop It! lets you experiment with the concepts of mean, median, and mode (measures of center). You see the differences among them on a bar graph, as you add or remove blocks to an axis with a given range.
Better Lesson
Better Lesson: Analyze This Part 2!
Srudents connect mean, median, mode and range to real life. It will allow students to make sense of problems by using previously taught strategies.
University of Georgia
University of Georgia: Measures of Variation
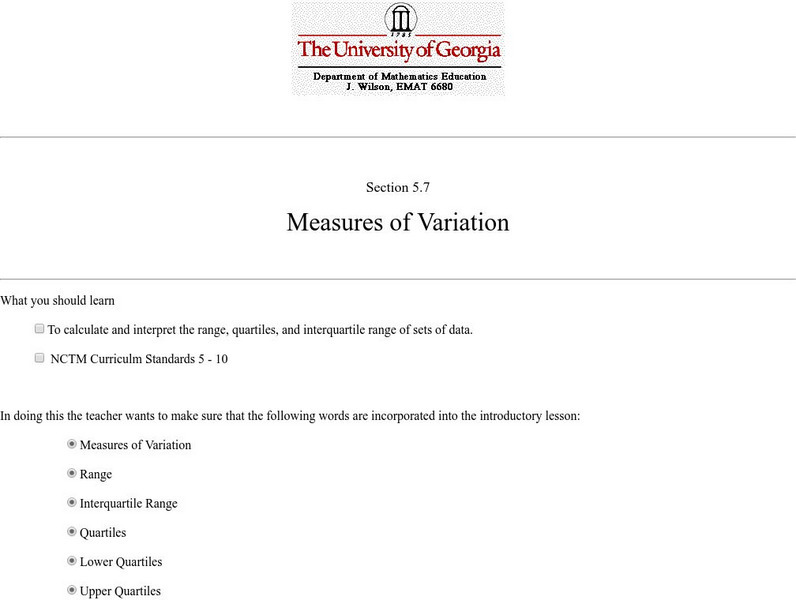
Lesson plan introduces and explains how to calculate measures of variation concepts such as range and quartile.
Shodor Education Foundation
Shodor Interactivate: Measures
Enter data and view the mean, median, variance, and standard deviation of the data set.
Better Lesson
Better Lesson: What Does the Data Tell Us? Describing Data
Understanding how to interpret data by its shape, spread, and center helps students to understand statistics.
Shodor Education Foundation
Shodor Interactivate: Lesson: Box Plots
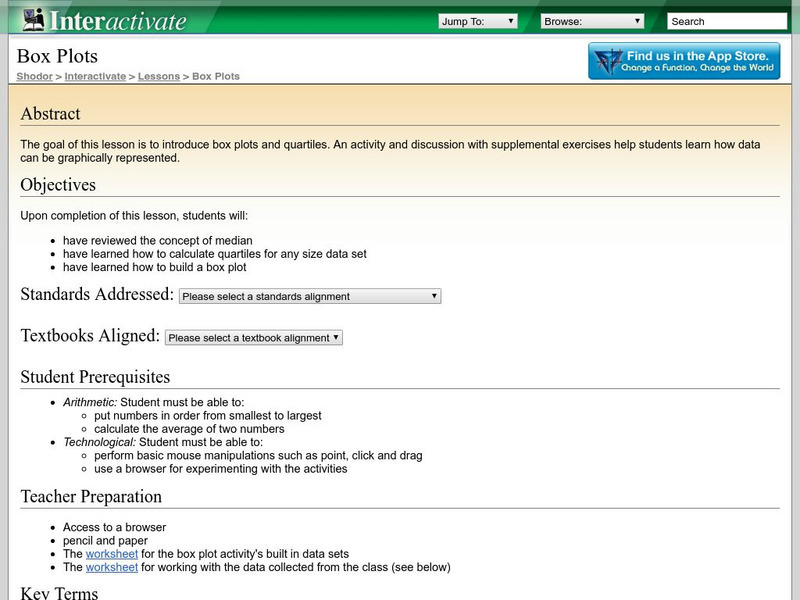
This lesson plan introduces quartiles and box plots. It contains an activity and discussion. Supplemental activities about how students can represent data graphically are also included.
Alabama Learning Exchange
Alex: University and College Tuition Webquest
This is a technology-based and interdisciplinary project incorporating mathematics, language, and technology standards. Each student will research on the university's website: location, the mission statement, historical and interesting...
Education Place
Houghton Mifflin: Eduplace: Math Steps: What Is It? Data
This is a great place for lesson information on the concept of analyzing data - measures of central tendency. Three other tabs are available besides the "What Is It?" link. Tips and Tricks, When Students Ask, and Lesson Ideas also...
Other
College of Natural Sciences: Measures of Location
Different measures of location are discussed in terms of box and whisker plots.
Science Education Resource Center at Carleton College
Serc: Birds: How Do We Increase the Bird Population at Our School?
This is a lesson of how to improve our environment as well as how to enjoy it. The students will sit in the schoolyard, study pictures of birds and then compile similarities and differences. Students will observe live birds in the yard...
Calculator Soup
Calculator Soup: Statistics Calculator
Calculate basic summary statistics for a sample or population data set including minimum, maximum, range, sum, count, mean, median, mode, standard deviation and variance.
Texas Instruments
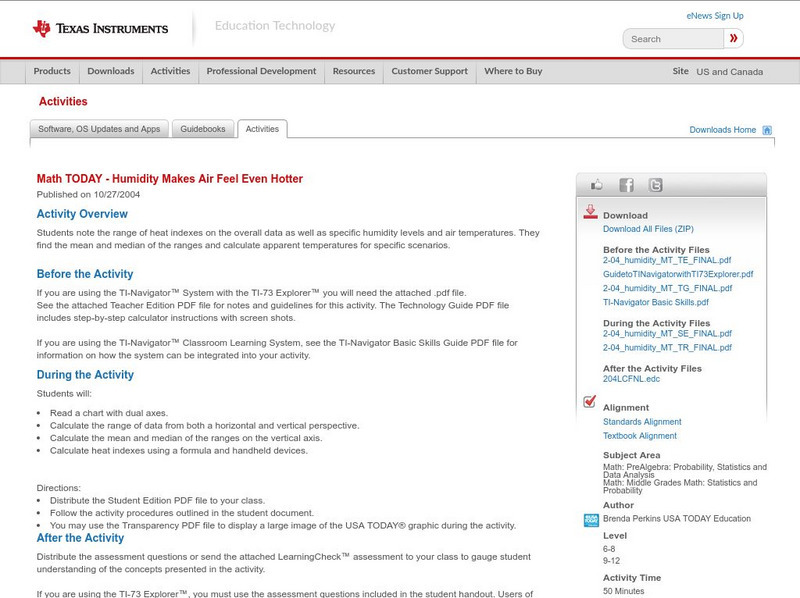
Texas Instruments: Math Today Humidity Makes Air Feel Even Hotter
Students note the range of heat indexes on the overall data as well as specific humidity levels and air temperatures. They find the mean and median of the ranges and calculate apparent temperatures for specific scenarios.
McGraw Hill
Mc Graw Hill Education: Glencoe: Measures of Variation
Lesson examples that review how to calculate measures of variation such as range and outliers.
Other popular searches
- Mean Median Mode and Range
- Mean, Median, Mode, and Range
- Mean, Median, Mode and Range
- Range Median and Mode
- Mean, Median and Range
- Mode, Median and Range
- Mean Median and Range
- Range, Median and Mode
- Median and Range Chart
- Median, Range and Mode
- Mean, Median. Mode, and Range
- Range, Median, and Mode


