Hi, what do you want to do?
CK-12 Foundation
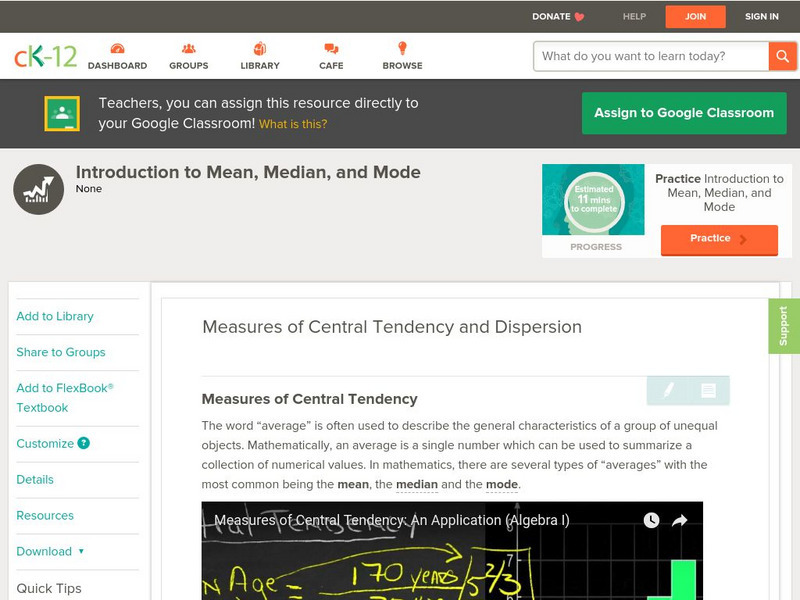
Ck 12: Measures of Central Tendency and Dispersion Grades 9 10
[Free Registration/Login may be required to access all resource tools.] Decide which measure of central tendency best describes a data set.
Khan Academy
Khan Academy: Practice: Calculating the Median
Practice ordering a set of data and then finding the median of the data set.
Khan Academy
Khan Academy: Calculating the Median
Practice finding the median of a data set. Students are able to check their answers, view a solution, and watch a video or use a hint.
Khan Academy
Khan Academy: Calculating the Mean
Practice calculating the mean of a data set. Data is displayed in different forms of graphical representation.
Calculator Soup
Calculator Soup: Statistics Calculator
Calculate basic summary statistics for a sample or population data set including minimum, maximum, range, sum, count, mean, median, mode, standard deviation and variance.
Primary Resources
Primary Resources: Mean, Median, Mode, and Range
Here are some teacher resources to aid in teaching mean, median, mode and range. Includes worksheets, games, and PowerPoint presentations.
ClassFlow
Class Flow: Statistics Landmarks Vote
[Free Registration/Login Required] This lesson uses clustering to explore the concept of mean, median, and mode of a set of data and calculates the arithmetic mean.
Soft Schools
Soft Schools: Probability and Statistics Quiz
Students are asked to find the mean, median, mode, and range of a data set. Also, they must be able to interpret graphs and tables, and graphically represent data. The quiz is multiple choice and consists of nine questions, and a summary...
Texas Instruments
Texas Instruments: Statistics for Math B
Students will determine the mean, median, mode and standard deviation of collected data. They will make a frequency histogram of the grouped data, both on graph paper, and on the TI 83+.
Other
Meta Calculator: Statistics Calculator
A web-based statistics calculator to find mean, median, standard deviation, variance and ranges.
Alabama Learning Exchange
Alex: My Peanut Butter Is Better Than Yours!
The students will engage in the process of statistical data comparing data using tables and scatterplots. The students will compare data using measures of center (mean and median) and measures of spread (range). This lesson can be done...
Calculator Soup
Calculator Soup: Mean, Median, Mode Calculator
Calculate mean, median, mode along with the minimum, maximum, range, count, and sum for a set of data.
CK-12 Foundation
Ck 12: Measures of Central Tendency and Dispersion Grades 8 9
[Free Registration/Login may be required to access all resource tools.] Learn how to calculate different measures of central tendency, as well as the spread or dispersion of the data.
CK-12 Foundation
Ck 12: Measures of Central Tendency and Dispersion Grades 9 10
[Free Registration/Login may be required to access all resource tools.] Decide which measure of central tendency best describes a data set.
The Balance
The Balance: What Is Income Per Capita
Income per capita can mean several things, depending on how it is measured. This article explains the various measurements, as well as other ways to measure income.
Illustrative Mathematics
Illustrative Mathematics: S Id.3 Describing Data Sets With Outliers
For certain data sets, such as home prices and household or individual income, is often described using the median instead of the mean. This lesson explores the mean and median in some different situations to help you understand the...
Curated OER
Image for Mean
An overview of the statistical term, "mean." An example is provided for explanation. Links are given to other related terms: central limit theorem, population, median, and mode.
Beacon Learning Center
Beacon Learning Center: All That Data
Students analyze data by finding the mean, median, mode, and range of a set of numbers. Line plots, bar graphs, and circle graphs are also included in this lesson.
Khan Academy
Khan Academy: Comparing Data Distributions
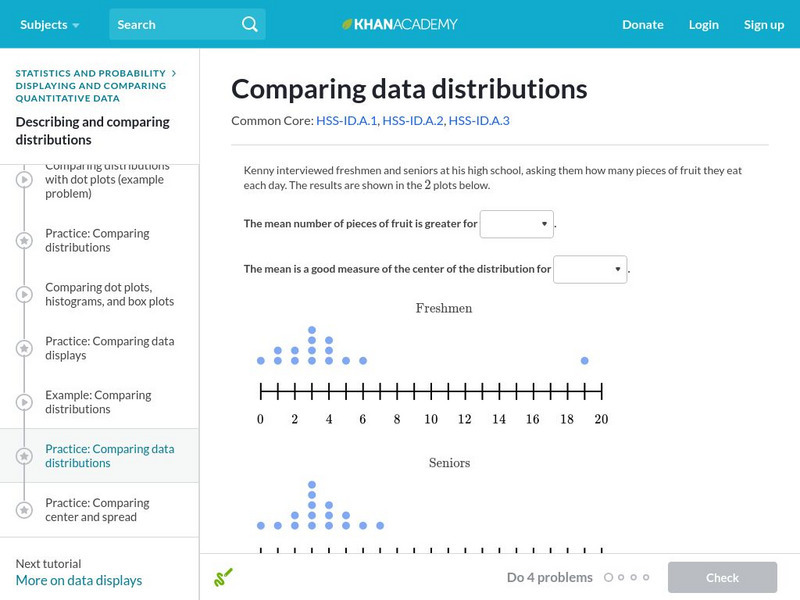
Take a look at two different data distributions and draw some comparisons. Students receive immediate feedback and have the opportunity to try questions repeatedly, watch a video or receive hints.
Education Place
Houghton Mifflin: Eduplace: Math Steps: What Is It? Data
This is a great place for lesson information on the concept of analyzing data - measures of central tendency. Three other tabs are available besides the "What Is It?" link. Tips and Tricks, When Students Ask, and Lesson Ideas also...
University of Illinois
University of Illinois: Rollin' Rollin' Rollin'
This resource is the beginning of a series of pages that demonstrates the diffference between the mean and median of a group of numbers. Uses bar graphs to display the data.
PBS
Pbs Mathline: Whirlybirds [Pdf]
This engaging lesson combines the concepts of statistics and measurement. Students create a simulation of a parachute jump using whirlybirds, to predict the frequency of an event occurring. A detailed lesson plan which includes a list of...
Other
College of Natural Sciences: Measures of Location
Different measures of location are discussed in terms of box and whisker plots.
Other
Rhl School: Math Problem Solving
Utilize this site for lesson plans and worksheets to help your students with math problem-solving.


