Curated OER
Taste the Rainbow
Students practice estimating and graphing by utilizing Skittles. In this statistics instructional activity, students complete worksheets based on the likelihood of a certain color of skittle coming out of the bag. Students create a...
Curated OER
Atlatl Lessons Grade 4-12
Students experiment with velocity, ratios, and rates. In this data management activity, students throw a dart with and without using an atlatl and collect and record various data. Students construct ratios based on the data and determine...
Achieve
Greenhouse Management
Who knew running a greenhouse required so much math? Amaze future mathematicians and farmers with the amount of unit conversions, ratio and proportional reasoning, and geometric applications involved by having them complete the...
Curated OER
Weather Watchers
Students collect and analyze data about the weather. For this algebra lesson, students organize and graph their data using graphs, line plots and stem and leaf plots. They make observation and draw conclusion using their data.
Curated OER
How Fast Is Your Car?
Eighth graders discover the relationship between speed, distance, and time. They calculate speed and represent their data graphically. They, in groups, design a ramp for their matchbox car. The goal is to see who's ramp produces the...
Curated OER
Count The Letters
Students perform activities involving ratios, proportions and percents. Given a newspaper article, groups of students count the number of letters in a given area. They use calculators and data collected to construct a pie chart and bar...
Savvas Learning
Saxon Math 5/4
You'll never have to search for another worksheet again after downloading this extensive collection of Saxon math materials. With over 600 pages of example problems and skills practice exercises, this is a must-have resource for any...
Curated OER
Approximation of Pi
Students explore the concept of Pi. In this Pi lesson plan, students measure the circumference and diameter of a circle. Students record the diameter and circumference measurements from their classmates. Students enter the data into...
Curated OER
Let's Gather Around the Circle
Scholars explore the relationship between circumference and diameter. Groups of learners measure the diameter and circumference of round objects and record their data on a given worksheet. They then input the data into their graphing...
Curated OER
Addendum to the Written Curriculum: Measuring Solids
Students use standard rulers to measure the length of common classroom items - such as pencils, books, desk tops - in inches and centimeters, and measure weight in pounds. They also answer math questions, such as "How long is the front...
Curated OER
Mean, Median, Mode and Range
Seventh graders identify the mean, mode, median and range in a given set of data. After playing "What's My Number" game, 7th graders brainstorm situations in which measurement of statistical data is important. They measure specified...
Curated OER
More Jelly Bean Math
Students use their color categorized jelly beans to find the range, mean, median and mode. They use their recorded data documenting how many jelly beans there are for each color in order to calculate the range, mean, median and mode of...
Curated OER
Centimeter Slinkies
Third graders estimate and measure the length of a whole color-segmented, candy gummy worm. Then, as students bite off each segment, they estimate, measure and record findings in an activity log.
Curated OER
Altering a Plant Environment
Students investigate what a controlled group is by creating an experiment. In this plant growth lesson, students identify the different parts of a plant and discuss what is needed for a plant to be successfully grown. Students grow a...
Bowland
AstroZoo
Rescue animals in the zoo by applying math concepts. Groups of learners solve three missions involving oxygen, food, and climate control. Each group selects an animal from one of four bio-domes.
Curated OER
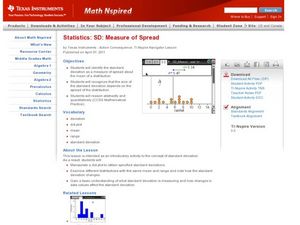
Measure of Spread
Students identify the standard deviation. In this statistics lesson, students find the mean distribution and calculate the percent of deviation from the mean. They observe this change on the Ti calculator.
Curated OER
Wings and Othe Things
Students work in groups that are engaged in different activities at different times. They watch the video "Madagascar" and collect data pertaining to the Fish Eagle's arm spam. They work together to perform mathematical computations...
Curated OER
Timed Multiplication Test Graphs
Students use the tools of data analysis for managing information. They solve problems by generating, collecting, organizing, displaying histograms on bar graphs, circle graphs, line graphs, pictographs and charts. Students determine...
Curated OER
Graphing
Students collect data to create different types of graphs-line, pie, and bar graphs. They use StarOffice 6.0 to create graphs.
Curated OER
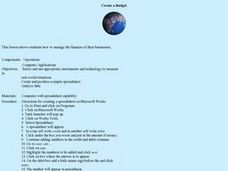
Create a Budget
Students develop a budget spreadsheet to manage finances for their business. In this finance activity, students use a spreadsheet program to create a budget with credit and debit columns. There are step-by-step directions for creating...
Curated OER
Using Active Learning to Reinforce Mathematics
Students predict, then measure how far a bug can travel on a "course" over a specified amount of time, then construct graphs based on the data they acquire.
Intel
Metric Madness
Scholars learn about the metric system and produce a presentation on how to convert within the metric system. They then develop a brochure in support of legislation requiring the use of the metric system.
Curated OER
Fun Creative Activities that Teach Math
Students have fun with math. In this math skills lesson, students collaborate to solve the problems presented in this interactive lesson. The problems pertain to geometry, measurement, probability, number sense, and algebra.
Curated OER
Clean Water vs. Dirty Water
Students study the importance of clean water to the survival of organisms and what activiities and material pollute water. They measure the temperature of water samples and create a class graph.


