Hi, what do you want to do?
Curated OER
Central Tendencies and Normal Distribution Curve
Fourth graders are given data (class test scores) to determine central tendencies, and find information needed to construct a normal distribution curve. They become proficient in calculating mode, median and average.
Curated OER
Decimals and Fractions
Students learn about using decimals and fractions by referring to a 19th century currency table. In this decimals and fractions lesson plan, students discuss converting pounds to coins and how they relate to fractions and decimals.
United Nations
Unesco: Measures of Dispersion
Explanation of the different measures of dispersion (range, interquartile range, and standard deviation) are given.
CK-12 Foundation
Ck 12: Measures of Central Tendency and Dispersion Grades 8 9
[Free Registration/Login may be required to access all resource tools.] Learn how to calculate different measures of central tendency, as well as the spread or dispersion of the data.
CK-12 Foundation
Ck 12: Measures of Central Tendency and Dispersion Grades 9 10
[Free Registration/Login may be required to access all resource tools.] Decide which measure of central tendency best describes a data set.
CK-12 Foundation
Ck 12: Measures of Central Tendency and Dispersion Grades 11 12
[Free Registration/Login may be required to access all resource tools.] This Concept introduces students to the most common measures of central tendency: the mean, median and mode.
CK-12 Foundation
Ck 12: Statistics: Measures of Spread/dispersion Grades 11 12
[Free Registration/Login may be required to access all resource tools.] This Concept introduces students to the some of the measures of spread commonly used, such as range, standard deviation and variance.
CK-12 Foundation
Ck 12: Measures of Central Tendency and Dispersion Grades 9 10
[Free Registration/Login may be required to access all resource tools.] Decide which measure of central tendency best describes a data set.
CK-12 Foundation
Ck 12: Measures of Central Tendency and Dispersion Grade 8
[Free Registration/Login may be required to access all resource tools.] Find the mean, median, mode and range of a data set.
Other
James Wright: Measures of Central Tendency
This site looks at measures of central tendency and dispersion. Discussed are topics such as standard deviation, mean, median, and mode.
CK-12 Foundation
Ck 12: Statistics: Measures of Spread/dispersion Grade 8
[Free Registration/Login may be required to access all resource tools.] Understanding the mean and statistical deviations.
Stefan Warner and Steven R. Costenoble
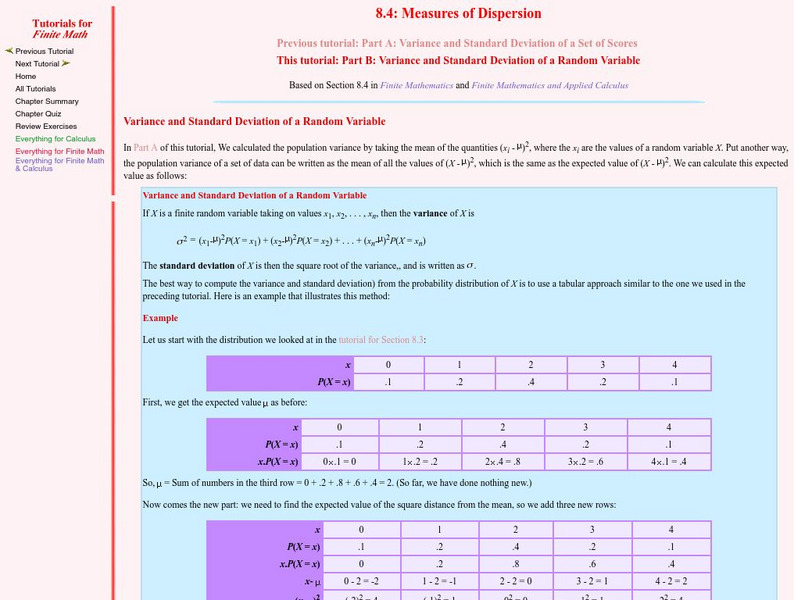
Finite Mathematics & Applied Calculus: Variance and Standard Deviation of a Random Variable
Students learn about the variance and standard deviation of a random variable. The tutorial investigates the statistics concepts through class notes and examples. Review exercises and a chapter quiz are included.
University of Cambridge
University of Cambridge: Maths and Sports: Olympic Triathlon
Do you think the triathlon will be won by someone who is very strong in one event and average in the other two, or someone who is strong in all three disciplines? This activity challenges students to analyse real-life data and use their...
Stefan Warner and Steven R. Costenoble
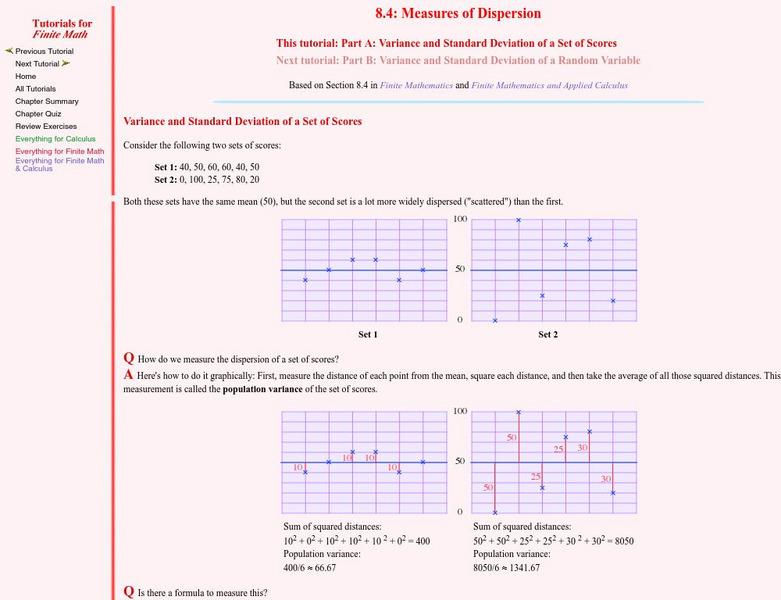
Finite Mathematics & Applied Calculus: Variance and Standard Deviation of a Set of Scores
Students learn about the variance and standard deviation of a set of scores. Topics explored are the empirical rule and Chebyshev's rule. The tutorial investigates the statistics concepts through class notes and examples. Review...
Annenberg Foundation
Annenberg Learner: Learning Math: Min, Max and the Five Number Summary
Explore how to interpret a large set of data by dividing it up into smaller portions in order to answer statistical questions.
Cuemath
Cuemath: How to Find Interquartile Range
A comprehensive guide for exploring the topic of interquartile range by finding answers to questions like what is meant by interquartile range, how to find interquartile range, and what is the formula for interquartile range. Includes...
Other
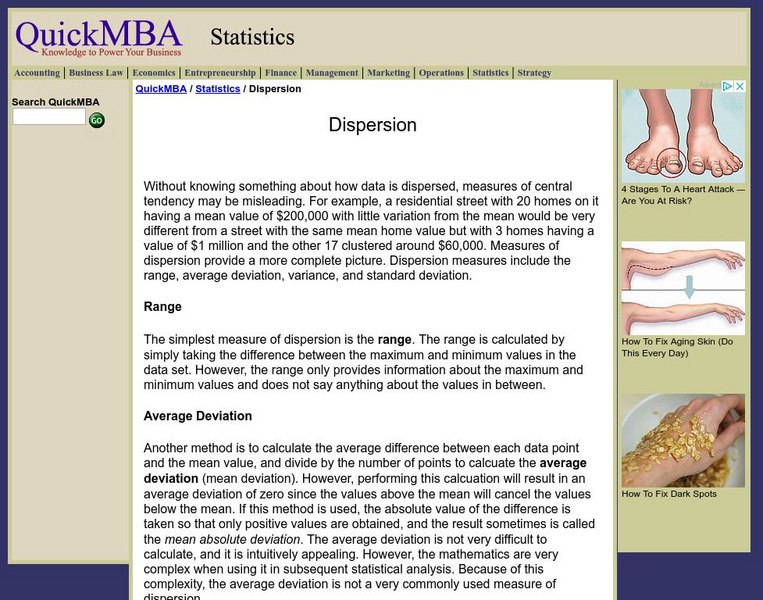
Dispersion
This site discusses the range, average deviation, variance, and standard deviation, as well as their relation to dispersion.
Palomar Community College District
Palomar College: Behavioral Science Statistics: Variance and Standard Deviation
A series of step-by-step worked problems demonstrating how to take a set of data and produce the variance and standard. Hints are provided along the way and the final measures are shown for the user to check.
Calculator Soup
Calculator Soup: Variance Calculator
Variance is a measure of dispersion of data points from the mean. Low variance indicates that data points are generally similar and do not vary widely from the mean. High variance indicates that data values have greater variability and...
Calculator Soup
Calculator Soup: Standard Deviation Calculator
Standard deviation is a statistical measure of diversity or variability in a data set. A low standard deviation indicates that data points are generally close to the mean or the average value. A high standard deviation indicates greater...
Other
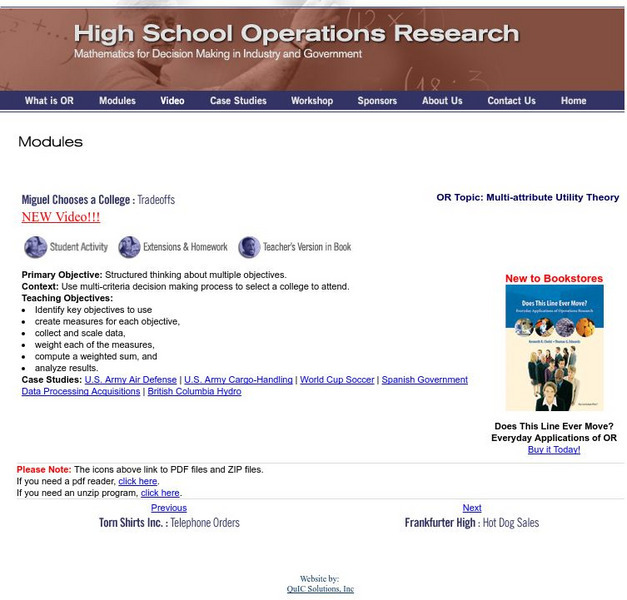
Hsor.org: Miguel Chooses a College: Tradeoffs
Use several strategies and criteria to help Miguel determine the college for him.
Sophia Learning
Sophia: Standard Deviation
Students learn how to calculate the standard deviation by hand. Detailed examples that explore how to use the standard deviation formula are included.


