Hi, what do you want to do?
Other
Magoosh: Statistics Fundamentals
An online course on the fundamentals of statistics including video lessons in Mean, Median, and Mode; Weighted Averages; Quartiles and Boxplots; Range and Standard Deviation; Normal Distribution; Z-scores; Intro to Inferential...
Better Lesson
Better Lesson: Analyze This Part 2!
Srudents connect mean, median, mode and range to real life. It will allow students to make sense of problems by using previously taught strategies.
Shodor Education Foundation
Shodor Interactivate: Plop It!
PlopIt allows users to build dot plots of data using the mouse. View how the mean, median, and mode change as entries are added to the plot.
PBS
Pbs Learning Media: Central Tendency: Targeted Math Instruction
At the end of this lesson, students will be able to recognize and apply the concepts of mean, median, and mode in real-life problems.
Shodor Education Foundation
Shodor Interactivate: Measures
Enter data and view the mean, median, variance, and standard deviation of the data set.
Illustrative Mathematics
Illustrative Mathematics: 6.sp Puppy Weights
A performance task asking students to create a graph of provided information and then answer two questions about the information provided with that graph.
Other
Stat Soft: Statistics Glossary
Dozens of statistical terms are defined and illustrated in this glossary.
Shodor Education Foundation
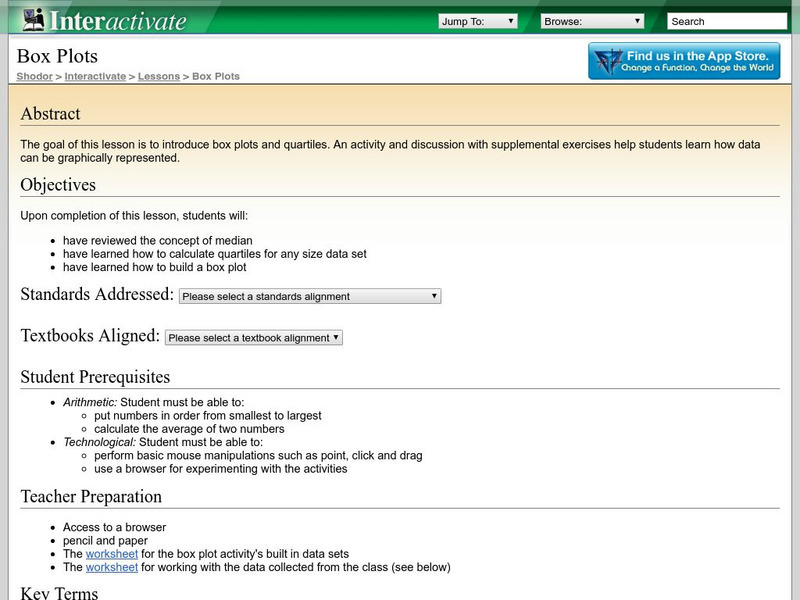
Shodor Interactivate: Lesson: Box Plots
This lesson plan introduces quartiles and box plots. It contains an activity and discussion. Supplemental activities about how students can represent data graphically are also included.
ClassFlow
Class Flow: Statistics Landmarks Vote
[Free Registration/Login Required] This lesson uses clustering to explore the concept of mean, median, and mode of a set of data and calculates the arithmetic mean.
Other
James Wright: Measures of Central Tendency
This site looks at measures of central tendency and dispersion. Discussed are topics such as standard deviation, mean, median, and mode.
Math Slice
Math Slice: Statistics: Math Worksheets
This tool allows you to create worksheets where students calculate the mean, median, mode or range of a set of numbers.
That Quiz
That Quiz: Medias
This interactive activity is designed as a review to the concept of mean, median and mode.
Calculator Soup
Calculator Soup: Statistics Calculator
Calculate basic summary statistics for a sample or population data set including minimum, maximum, range, sum, count, mean, median, mode, standard deviation and variance.
CK-12 Foundation
Ck 12: Measures of Central Tendency and Dispersion Grades 9 10
[Free Registration/Login may be required to access all resource tools.] Decide which measure of central tendency best describes a data set.
CK-12 Foundation
Ck 12: Measures of Central Tendency and Dispersion Grades 8 9
[Free Registration/Login may be required to access all resource tools.] Learn how to calculate different measures of central tendency, as well as the spread or dispersion of the data.
Shodor Education Foundation
Shodor Interactivate: Stem and Leaf Plot
Shodor offers this interactive Stem and Leaf Plotter. The mean, median, and mode may be calculated or checked for accurracy with your given data. Be sure to check the "What?" link to find exercises and a lesson plan.
Texas Instruments
Texas Instruments: Statistics for Math B
Students will determine the mean, median, mode and standard deviation of collected data. They will make a frequency histogram of the grouped data, both on graph paper, and on the TI 83+.
Science Education Resource Center at Carleton College
Serc: Birds: How Do We Increase the Bird Population at Our School?
This is a lesson of how to improve our environment as well as how to enjoy it. The students will sit in the schoolyard, study pictures of birds and then compile similarities and differences. Students will observe live birds in the yard...
Soft Schools
Soft Schools: Probability and Statistics Quiz
Students are asked to find the mean, median, mode, and range of a data set. Also, they must be able to interpret graphs and tables, and graphically represent data. The quiz is multiple choice and consists of nine questions, and a summary...
Better Lesson
Better Lesson: Understanding Data!
Fourth graders will gear up to explore how to find the means, median, and modes to represent data.
PBS
Pbs Learning Media: Restocking Shoes
In this video from Cyberchase, Bianca uses data on past shoe sales to help her decide what quantities of each size she should order in the next shipment.
That Quiz
That Quiz: Practice Test: Graphs
This resource allows users to test their knowledge of graphs and graphing methods.
Education Development Center
Math Partners: Statistics and Probability [Pdf]
Comprehensive unit that consists of lessons and activities designed to help students learn statistics and probability concepts.
University of Texas
Inside Mathematics: Baseball Players [Pdf]
This task challenges learners to demonstrate understanding of the concept of measure of center.
Other popular searches
- Mean, Median, Mode
- Mean Median Mode
- Graphing Mean, Median, Mode
- Free Mean, Median, Mode
- Math; Mean, Median, Mode
- Mean Median Mode Range
- Mean, Median, Mode Range
- Mean Median and Mode
- Mean, Median, Mode, Range
- Mean, Median and Mode
- Mean Median Mode Lessons
- Mean, Median, Mode Unit


