Alabama Learning Exchange
Alex: The Mean, Median, and Mode Chain Gang
Cooperative learning groups and chain links are used to find the mean, median, and mode. A Science NetLinks activity is linked for further real-life application in the world of baseball (optional). This lesson plan was created as a...
Shodor Education Foundation
Shodor Interactivate: Lesson: Introduction to Statistics
"The goal of this lesson is to introduce the concepts of mean, median and mode and to develop understanding and familiarity with these ideas." This lesson is provided by Shodor Education Foundation.
Better Lesson
Better Lesson: Analyze This! Mean Median Mode and Range
Finding measures of central tendency will be applied to the different graphs throughout this unit.
Sophia Learning
Sophia: Finding Mean, Median, and Mode: Lesson 1
This lesson will demonstrate how to find the mean, median, and mode for a set of data. It is 1 of 5 in the series titled "Finding Mean, Median, and Mode."
CK-12 Foundation
Ck 12: Statistics: Stem and Leaf Plots, Mean, Median, and Mode
[Free Registration/Login may be required to access all resource tools.] Find the mean, median, and mode of a set of data displayed in a stem-and-leaf plot.
Better Lesson
Better Lesson: Analyze This Part 2!
Srudents connect mean, median, mode and range to real life. It will allow students to make sense of problems by using previously taught strategies.
Sophia Learning
Sophia: Finding Mean, Median, and Mode: Lesson 5
This lesson will demonstrate how to find the mean, median, and mode for a set of data. It is 5 of 5 in the series titled "Finding Mean, Median, and Mode."
Alabama Learning Exchange
Alex: Estimation Station
During this lesson, students will learn the difference between estimation and guessing. Knowing how to estimate is an essential skill that will help students determine approximate totals as well as check the reasonableness of their...
Shodor Education Foundation
Shodor Interactivate: Lesson: Box Plots
This lesson plan introduces quartiles and box plots. It contains an activity and discussion. Supplemental activities about how students can represent data graphically are also included.
CK-12 Foundation
Ck 12: Physical Science: Descriptive Statistics
[Free Registration/Login may be required to access all resource tools.] Explains descriptive statistics (mean, median, mode, range).
Beacon Learning Center
Beacon Learning Center: All That Data
Students analyze data by finding the mean, median, mode, and range of a set of numbers. Line plots, bar graphs, and circle graphs are also included in this lesson.
Other
Raymond Geddes and Company, Inc.: Analyzing Product Price and Sales Data
Lesson plan provides a real-world application of mean, median, mode, and range.
Varsity Tutors
Varsity Tutors: Hotmath: Practice Problems: Statistics
Fifteen problems presented on the topics: mean, median, mode, outliers and graphing statistics. They are given with each step to the solution cleverly revealed one at a time. You can work each step of the problem then click the "View...
Khan Academy
Khan Academy: Center and Spread Lesson
The resource from Khan Academy provides practice questions for the Praxis Core Math Test. This section reviews probability and statistics questions connected to the center and spread of data in a collection.
Math Planet
Math Planet: The Mean, the Median, and the Mode
Gain an understanding of how to find the mean, median and mode by viewing examples and a video lesson. [2:22]
CK-12 Foundation
Ck 12: Measures of Central Tendency and Dispersion Grade 8
[Free Registration/Login may be required to access all resource tools.] Find the mean, median, mode and range of a data set.
Beacon Learning Center
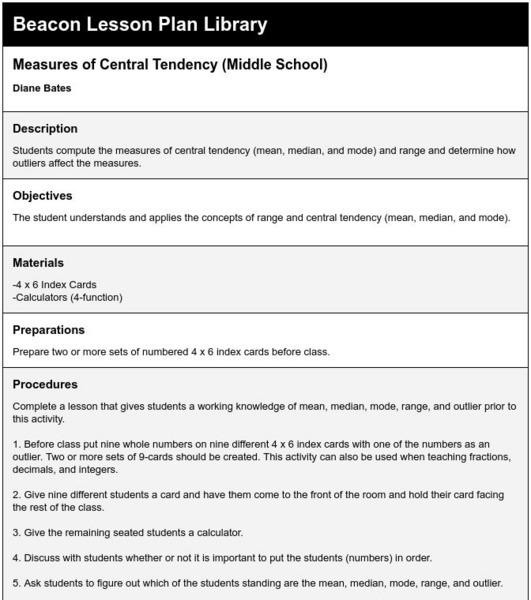
Beacon Learning Center: Measures of Central Tendency (Middle School)
Lesson plan provides practice for calculating measures of center.
Other
Magoosh: Statistics Fundamentals
An online course on the fundamentals of statistics including video lessons in Mean, Median, and Mode; Weighted Averages; Quartiles and Boxplots; Range and Standard Deviation; Normal Distribution; Z-scores; Intro to Inferential...
PBS
Pbs Learning Media: Central Tendency: Targeted Math Instruction
At the end of this instructional activity, students will be able to recognize and apply the concepts of mean, median, and mode in real-life problems.
Shodor Education Foundation
Shodor Interactivate: Lesson: Stem and Leaf Plots
Lesson plan introduces students to stem-and-leaf plots. Many resources are available for student and teachers here.
Better Lesson
Better Lesson: What Does the Data Tell Us? Describing Data
Understanding how to interpret data by its shape, spread, and center helps students to understand statistics.
Education Development Center
Math Partners: Statistics and Probability [Pdf]
Comprehensive unit that consists of lessons and activities designed to help students learn statistics and probability concepts.
Better Lesson
Better Lesson: Understanding Data!
Fourth graders will gear up to explore how to find the means, median, and modes to represent data.
Sophia Learning
Sophia: Using Different Measures of Central Tendency: Lesson 3
This lesson demonstrates how the different measures of central tendency can cause you to look at data differently. It is 3 of 5 in the series titled "Using Different Measures of Central Tendency."

