Virginia Department of Education
Middle School Mathematics Vocabulary Word Wall Cards
Having a good working knowledge of math vocabulary is so important for learners as they progress through different levels of mathematical learning. Here is 125 pages worth of wonderfully constructed vocabulary and concept review cards....
Curated OER
How's The Weather?
Students make a box and whiskers plot using the TI-73 graphing calculator. Each student would have their own calculator but they would work in small groups of two or three to help each other enter the data and make the plots.
Curated OER
Height versus Shoe Size
Middle schoolers find a correlation between a person's height and his/her shoe size. They have access to entering data into lists on a graphing calculator and can complete scatter plots. Students read and interpret a scatter plot and use...
Curated OER
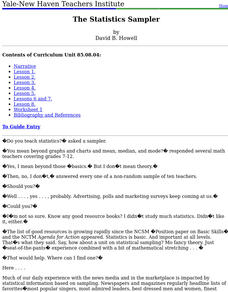
The Statistics Sampler
Learners define sample, describe a random sample, and discuss what compromises a sample. They determine a sample size to estimate a population characteristic with confidence.
Curated OER
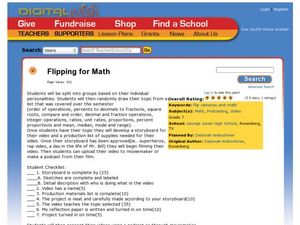
Flipping For Math
Seventh graders create a video of different formats to deliver a presentation of a math concept such as square roots, decimals, fractions, and more. In this math presentation lesson plan, 7th graders can plan a rap video, story,...
Curated OER
Statistics Newscast in Math Class
Students study sports teams, gather data about the teams, and create a newscast about their data. In this sports analysis instructional activity, students research two teams and define their statistical data. Students compare the two...
Curated OER
Macbeth Madness
Learners research Macbeth online and complete computer and graphing activities for the play. In this Macbeth activities lesson, students research Macbeth and bookmark the URL's. Learners complete activities for the topic on spreadsheets...
Curated OER
Perplexing Patterns
Seventh graders identify and find missing patterns. In this algebra lesson, 7th graders investigate numbers and sequences and complete the pattern. They make a chart and discuss similarities and differences.
Curated OER
What I Didn't Know...
Students practice creating wikis. In this wiki lesson, students create a wiki about any math topic that they know nothing about. Students learn about their topic and create a wiki that explains the math topic in detail.
Curated OER
Designing Detectives
Third graders explore the idea of formulating a hypothesis and designing an experiment to test the hypothesis.
Curated OER
Eat Your Veggies
Students investigate displaying data. In this displaying data lesson plan, students use tallies to count data about food preferences. Students use various types of graphs such as bar graphs, picture graphs, box-and-whisker plots, etc...
Curated OER
Looking for More Clues
Fifth graders explore how to collect data and display it on a bar and circle graph.
Curated OER
Graphing
Students collect data to create different types of graphs-line, pie, and bar graphs. They use StarOffice 6.0 to create graphs.
Curated OER
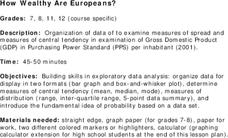
How Wealthy Are Europeans?
Students investigate measures of central tendency. They examine compiled data and conduct critical analysis. The graph is focusing on the gross domestic product data. The lesson also reviews the concept of putting values in order of...
Curated OER
"So Tell Me About Your Trip..."
Young scholars research destinations and the factors involved in taking a trip and explore how averages play a part in making decisions. They explore how to find the average speed and the distance to a particular destination, they...
Curated OER
Observing the Evidence
Fifth graders explore how to do research from a large group. They explore how to choose a representative sample and collect data from it.
Curated OER
Dealing with Data
Seventh graders collect and analyze data. In the seventh grade data analysis lesson, 7th graders explore and/or create frequency tables, multiple bar graphs, circle graphs, pictographs, histograms, line plots, stem and leaf plots, and...
Curated OER
Closing the Case
Fifth graders collect data and prepare data displays using a survey with statistical information.
Curated OER
Our Class Record Book
Second graders, in groups, prepare a list of proposed record ideas for the class book.
Curated OER
Using Statistics to Uncover More Evidence
Fifth graders participate in an online Web lesson plan on ways of interpreting data. They conduct a survey and interpret the results in a journal entry.
Curated OER
Bias in Statistics
Students work to develop surveys and collect data. They display the data using circle graphs, histograms, box and whisker plots, and scatter plots. Students use multimedia tools to develop a visual presentation to display their data.
Curated OER
Flying High in Math
Seventh graders study how real airplanes fly and then they construct models of paper airplanes using design resources for the Internet and their own design. They use meaurement and caluculations in order to help them construct their...
Curated OER
Descriptive Statistics
Students demonstrate how to use frequency and scatter diagrams. In this statistics lesson, students are introduced to different techniques of representing data. Students sort and graph data on a worksheet and use a frequency diagram to...


