Kenan Fellows
Designing and Analyzing Data Collected from Wearable Devices to Solve Problems in Health Care
Wearable devices have become more the norm than the exception. Learners analyze data from a sample device with a regression analysis in a helpful hands-on lesson. Their focus is to determine if there is a connection between temperature...
Curated OER
Energy Audit
Students collect data about energy usage and use mathematical calculations to analyze their data. In this energy conservation and statistics math lesson, students survey their homes to complete an energy usage worksheet. Students...
Curated OER
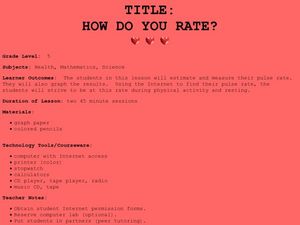
How Do You Rate?
Fifth graders make a graph. In this pulse rate lesson, 5th graders estimate their pulse and record it. Students measure their pulse while at rest and after physical activity and record it. Students use the internet to graph their results...
Baylor College
Body Mass Index (BMI)
How do you calculate your Body Mass Index, and why is this information a valuable indicator of health? Class members discover not only what BMI is and practice calculating it using the height and weight of six fictitious individuals, but...
Curated OER
Guess the Age
Students describe graphically, algebraically and verbally real-world phenomena as functions; identify the independent and the dependent variable. They translate among graphic, algebraic, and verbal representations of relations and graph...
Curated OER
Tasty Tech Activity With Excel
Students are introduce to basic Excel skills, rank their opinions of menu items from fast food restaurants, add their answers to the spreadsheet, and then create a simple graph of the results.
Curated OER
Burger King Investigation
Students study data on the nutritional value of Burger King meals in order to discover its nutritional value and also to compare the meals, using mathematical computation, to the recommended daily diet. In this data handling lesson...
Curated OER
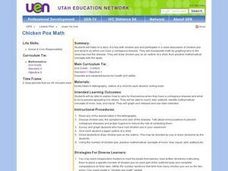
Chicken Pox Math
Second graders are read a story about a boy with chicken pox. As a class, they discuss what to do when you have a contagious disease and identify who in the class has had chicken pox. Using this information, they create a graph and use...
Curated OER
Heart Smart in a Heart Beat
As an introductory activity, young statisticians measure their heart rate at rest and after exercise and compute the mean and median, and create a box & whisker plot. This is followed by watching a video (that no longer seems...
Curated OER
Visual Representation of Reduced Fat
Middle schoolers demonstrate their understanding of the Five-Number Summary and Box-Plots by analyzing different nutrition labels from regular and reduced fat items using graphing calculators.
Curated OER
Stats on Reduced-Fat
Young scholars demonstrate an understanding of the Five-Number Summary and Box-Plots after analyzing data from nutrition labels, forming a hypothesis and supporting it. They decide if there is a significant difference between reduced fat...
Curated OER
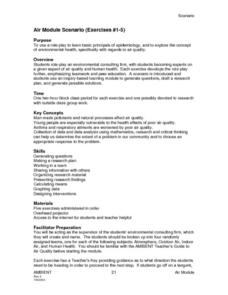
Air Module Scenario (Exercises #1-5)
Students, after researching/analyzing the concept of environmental health to air quality, role-play the basic principals of epidemiology. They act out a specific scenario to generate questions, draft a research plan, and generate...
Beyond Benign
Product Test
It's the moment of truth. Previous lessons in the 24-part series had scholars design and develop shampoo formulas using chemical concepts. The 18th lesson asks them to test the function of their shampoos. To do this, they calculate the...
Curated OER
Personal Code of Ethics
Tenth graders develop a personal code of ethics and relate their personal code of ethics to school situations. They discuss steps they will take to resolve ethical issue at school and develop a personal plan to advocate for an ethical...
Curated OER
Good Health
Students complete a unit with cross-curricular activities to learn about a healthy body and maintaining their health. In this health lesson, students complete 8 lessons to learn about good health, a healthy diet, healthy foods, healthy...
Curated OER
Food Pyramid Power: Looking Back and Moving Forward
Students show their knowledge of properties of objects as it pertains to sorting and creating patterns. In this food pyramid power lesson, students show their ability to use whole numbers in different representations by appling...
Curated OER
Whose Breakfast isn't for the Birds?
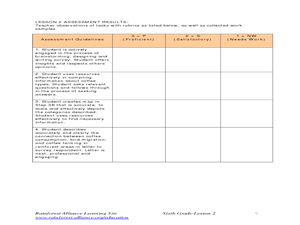
Students explore coffee production. In this cross-curriculum rainforest ecology lesson, students research regions where coffee comes from and investigate how the native birds in the rainforest are effected by coffee...
Curated OER
Is Organic Food Worth the Extra Cost?
Students calculate the amount of pesticide residue in selected foods for two
pesticides and determine if these levels are safe. They read an article about a
research study looking for metabolites of these pesticides in children. Finally,...
Curated OER
The Nutrients Public Transportation System
Students investigate the human circulatory system by experimenting with hoses. In this human body lesson, students create a system of hoses simulating the circulatory system which they utilize to pass objects through....
Curated OER
Risky Business
High schoolers view a video on AIDS, HIV and the ways in which HIV is spread. They discuss ways to avoid contracting HIV and participate in a simulation that shows the growth of a communicable disease.


