Curated OER
The Very Hungry Caterpillar
Read the story, The Very Hungry Caterpillar, and complete activities from multiple subjects. Make a mural, create a class graph, discuss the life cycle of a butterfly, research information about butterflies on the Internet and make a...
Curated OER
In Touch with Apples
Students read "How To Make an Apple Pie and See the World", the story of a girl who traveled the world to find the ingredients to make her apple pie. They conduct a series of interdisciplinary activities including testing their senses,...
Curated OER
Linguistic Diversity. Languages in Canada - Elementary
Create a language mosaic to reveal the linguistic diversity in your community. Pupils interview a person with a home language other than English and contribute to a bulletin board display representing the variety of languages spoken. The...
Curated OER
You mean college costs that much?
Seventh graders collect, organize, and analyze data as they research colleges on the Internet. They graph their collected data on a line graph and use a spreadsheet on Microsoft Excel in order to organize the data.
Curated OER
Our Favorite Season Lesson Plan
Fifth graders complete a survey about their favorite season of the year. Using Excel, they create a graph using the chart wizard and copy it into Microsoft Word. They explore the relationship between the survey and the bar graph.
Curated OER
M & M Madness
Second graders graph M & M's by color. In this graphing lesson plan, 2nd graders first predict how many of each color they think are in a handful of M & M's. Then they graph the amounts of each color on a computer program....
Curated OER
New York State Testing Program: Mathematics Book 2, Grade 5
In this 5th grade math standardized test practice worksheet, students solve 7 multiple-step open-ended math problems based on New York academic standards.
Curated OER
Examine Methods of Reporting Research Results
Students analyze a research report and the list of components needed in a research report and then identify those components based on a set of standards using the scientific method. They collect data which can be used for a graphical...
Curated OER
I'm Out of Here
Students create a travel budget. In this budget lesson, students research vacation destinations. Working independently, students research destinations on the Internet and construct a budget for the vacation. Resources provided.
Curated OER
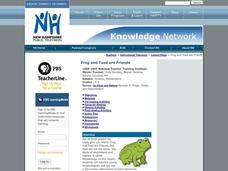
Frog and Toad are Friends
Students view a 30-minute video lesson to discover information about the characteristics of frogs and toads. They then transform themselves into frogs and participate in a Jumping Frog Jubilee. They work in groups of three to measure and...
Curated OER
What Can Scatterplots Tell Us?
Eighth graders use data from surveys conducted with parents, peers and themselves to create computer-generated scatterplots. They make inferences from their scatterplots.
Curated OER
Recording Frequency
First graders analyze nursery rhymes and gather data about word frequency. In this frequency lesson plan, 1st graders create graphs and tables. Students interpret the data.
Alabama Learning Exchange
Inch by Inch
Third graders listen to a read-aloud of Leo Lionni's, Inch by Inch before measuring a variety of items using both standard and metric units. They record the measurement data and follow a recipe for dirt pie.
Curated OER
Tall Tale Rollers
Students explore American tall tales. In this tall tale lesson plan, students discover the six characteristics that are included in tall tales. Students survey their class to find each student's favorite tall tale character and organize...
Curated OER
Pika Chew
Students work in collaborative teams with specific roles, use the Internet to research the behavior and ecology of pikas, make predictions about survival rates of pikas in different habitats and organize their data in graphs.
Curated OER
Jelly Bean's Galore
Students investigate the origins of the Jelly Bean. They complete a Scavenger Hunt using the jellybean website. Pupils create a bar graph using information collected about jelly beans. Students discuss the time of year that Jelly Beans...
Alabama Learning Exchange
The Grouchy Ladybug
Learners listen to the book, "The Grouchy Ladybug" by Eric Carle and sequence the events in the story. Using a graph, they draw and color the animals that the ladybug meets next to the corresponding time from the story, and conduct...
Curated OER
Macbeth Madness
Students research Macbeth online and complete computer and graphing activities for the play. In this Macbeth activities lesson, students research Macbeth and bookmark the URL's. Students complete activities for the topic on spreadsheets...
Curated OER
Name Clothesline Graph
Student matches the initial letter of his/her name with the corresponding letter on the clothesline. They then participate in the classroom discussions by offering information relevant to the topic and answering or asking questions...
Curated OER
How Much Will I Spend On Gas?
Students construct a linear graph. In this graphing lesson, students determine a monthly budget for gasoline. Students construct a t-chart and coordinate graph to display data. Resources are provided.
Curated OER
Probability With a Random Drawing
Students define probability, and predict, record, and discuss outcomes from a random drawing, then identify most likely and least likely outcomes. They conduct a random drawing, record the data on a data chart, analyze the data, and...
Curated OER
Building a Scale Model
Third graders create a model of the solar system. In this solar system instructional activity, 3rd graders create a scale model of the solar system. Working in pairs students solve mathematical problems to correctly measure the distance...
Curated OER
Investigating Transformations Of Parent Functions
Students identify the basic transformations of parent functions. They use their graphing calculator to create a transformation booklet by folding a sheet of computer paper in half and stapling along the folded edge.
Curated OER
Holly Leaves
Sixth graders analyze mathematics by participating in a botany activity. In this holly lesson, 6th graders identify if all holly leaves have the same amount of prickles by conducting a math survey. Students analyze many leaves and...


