Illustrative Mathematics
Illustrative Mathematics: F Le Choosing an Appropriate Growth Model
The goal of this task is to examine some population data for large cities from a modeling perspective. Learners are asked to decide if the population data can be accurately modeled by a linear, quadratic, and/or exponential function, and...
Illustrative Mathematics
Illustrative Mathematics: F if Logistic Growth Model, Explicit Version
For this task, students are presented with a graph showing the growth of the U.S. population from 1790 to 1940 and are given the equation for a logistic function for it. They are asked to use the equation and the graph to find the...
Annenberg Foundation
Annenberg Learner: Patterns in Mathematics: People Patterns
This interactive website offers young students an opportunity to discover the pattern and predict who will come next. Feedback and guidance are given for each response. It also offers three increasingly difficult levels that are available.
Alabama Learning Exchange
Alex: Can You Curl Your Tongue?
This lesson is adapted from a Connected Mathematics Unit, How Likely is It? This investigation introduces biology as a source of applications for probability. In this lesson, Curling your Tongue, students determine how many students in...
Science Buddies
Science Buddies: Frequency of Outcomes in a Small Number of Trials
People often draw conclusions from a small number of observations, but how easy is it to draw the wrong conclusion? Here is a simple project that shows the importance of making enough observations before making a prediction.
Other
Desmos: Charge!
In this interactive application of linear modeling, students make a prediction about the length of time it would take to charge a smartphone. They then work through a series of steps where they sketch their prediction, extend a table of...
Science Buddies
Science Buddies: Career Profile: Statistician
Statistics is a fascinating subject and everyone loves to spout them, but a statistician really knows how to use statistics to answer real-life questions and make predictions based on mathematical data. This Science Buddies site lays out...
PBS
Pbs Mathline: Fill 'Er Up Lesson Plan [Pdf]
Middle schoolers will pour liquids into different sized containers to test their predictions as to the amount each will hold. Printable lesson.
Texas Instruments
Texas Instruments: Pass the Ball
In this activity, students use mathematics to examine patterns that occur in a specific scenario and predict future events for the scenario. Data is collected on the time it takes to pass a ball. The students plot graphs, fit the data...
University of Illinois
University of Illinois Urbana Champaign: Trends Method in Mathematics
Site provides another method that can be used to forecast the weather: the trend method. This method is based on prior movement of the storm. Site utilizes data, charts, maps, and predictions.
Illustrative Mathematics
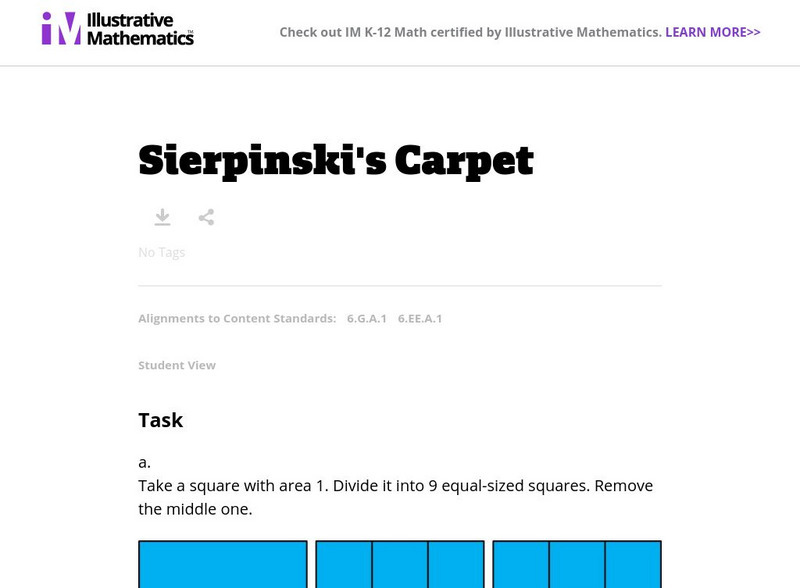
Illustrative Mathematics: 6.ee,g Sierpinski's Carpet
In this task, 6th graders are presented with a large square divided into 9 squares and the center square is then removed. They are asked to find the area of the 8 remaining squares. Each smaller square is divided in the same way and the...
Illustrative Mathematics
Illustrative Mathematics: 8.sp Laptop Battery Charge
This task looks at how long it takes for a laptop battery to fully charge. Students make a scatter plot of data, draw a 'line of best fit,' and predict the time it will take to reach a full charge. Aligns with 8.SP.A.2.
Illustrative Mathematics
Illustrative Mathematics: Longer and Heavier? Shorter and Heavier?
Students will compare the length and weight of several pairs of objects to learn that weight and length are separate measurable attributes, and not always related.
Alabama Learning Exchange
Alex: How Long Will It Take?
In this lesson, students will participate in a group activity using a sponge ball and a growing human circle. The students will be added to a circle in groups of two and will pass the sponge ball from hand to hand until it returns to the...
Alabama Learning Exchange
Alex: Who Bounces Best?
This is a cooperative learning, kinesthetic and presentation lesson. Students will use the computer to create graphs/charts to display data collected by counting the number of successful bounces when bouncing a basketball for 30 seconds....
National Council of Teachers of Mathematics
Nctm: Figure This: Beanie Babies, Profit or Loss
Is you Beanie Baby business booming or busted! Figure out if you made a profit or lost money in this mathematic computation activity. A one page activity from the NCTM Math Challenges for Families collection that focuses on adding and...

