Curated OER
Quadratic and Linear Functions
In this Algebra II learning exercise, 11th graders review and apply the basic concepts for solving linear and quadratic equation. The one page learning exercise contains twelve problems. Solutions are not provided.
Curated OER
Midpoint
In this geometry worksheet, 10th graders use the concept of midpoint of a line segment to solve problems in which they determine the length of the indicated segments. The one page worksheet contains twelve problems, including a...
Curated OER
Investigating Transformations
In this trigonometry worksheet, students investigate the transformations that can occur to the basic trigonometric functions. The thirteen page worksheet contains explanation, examples, and forty-seven questions. Answers are not included.
Curated OER
Graphing Solution of a Quadratic and Linear System
In this algebra worksheet, students identify the systems of equation as quadratics or linear. They graph their solutions. There are 4 questions with an answer key.
Curated OER
Proportionality in Tables, Graphs, and Equations
Students create different methods to analyze their data. In this algebra lesson, students differentiate between proportion and non-proportional graph. They use the TI-Navigator to create the graphs and move them around to make their...
Curated OER
Let's Go Slopey
Young scholars create a table of values to graph a line. In this algebra lesson, students identify the slope and intercept of a linear equation. They use a Ticalculator to graph their function.
Curated OER
Don't Fence Me In: Prisms
In this prism worksheet students explore the best way to divide a rectangular region into four areas using parallel lines. This one-page worksheet contains 1 problem. The answer is provided.
Curated OER
ABC's Transformer
Fourth graders design their own letter graph, and then produce the resulting graphs after a translation, reflection, and rotation. After a review of vocabulary, 4th graders create their graphs using crayons.
Curated OER
SAT Prep
In this secondary mathematics activity, students are provided with questions that are designed to provide SAT test preparation. The one page interactive activity contains ten questions. Answers are not provided.
Curated OER
New York State Testing Program Grade 8 Mathematics Test
In this eighth grade mathematics worksheet, 8th graders are presented with questions indicative of those on the eighth grade mathematics examination. The twelve page worksheet contains six free response questions that cover a variety of...
Curated OER
Conics and Graphing
In this algebra worksheet, students solve equations by graphing an ellipse, circle and hyperbola. They match equations to graphs and define each type of function. There are 20 questions total.
Curated OER
Exploring Trigonometric Ratios
Students calculate the different ratios using a right triangle. In this trigonometry lesson, students identify the sine, cosine and tangent of each side. They find the missing angles using the different ratios.
Curated OER
Two Variable Inequalities
In this algebra worksheet, students solve inequalities using addition, subtractions and multiplication. They graph the inequalities with shading. There are 2 questions.
Curated OER
Let the Matrix Do It
Students create a matrix of the vertices of a triangle and produce new matrices that dilate, translate, rotate, and reflect the original triangle. After multiplying each matrix by a new scale factor, they graph the new matrix and...
Curated OER
Spaghetti Bridges
Eighth graders experiment with building bridges of spaghetti, pennies, and a cup to determine how varying the number of spagetti pieces affects the strength of the bridge. They graph their results and interpret the data.
Curated OER
Systems of Equations
For this algebra worksheet, learners factor systems of equations using elimination and substitution. THey graph their lines and find the point of intersection. There are 15 questions.
Curated OER
Slope of a Line
Students identify the slope of a line. In this algebra activity, students discover the process of how to find the slope of a line and classify the slope as positive, negative, zero or undefined. They find the slope of a line given two...
Curated OER
Unit Circle and Triangle
Students apply the Unit Circle to solve ratios of triangles. In this geometry lesson, students derive the different ratios of a triangle using the Pythagorean Theorem. They find the angles of a unit circle using a right triangle.
Curated OER
Can you Find the Expression
Students collect data from measurements and weights for this experiment. In this algebra lesson plan, students analyze graphs they create form their data to find the expression representing the data. They label which graph provided the...
Curated OER
Matrices
In this Algebra II worksheet, 11th graders solve problems that involve matrix representation, matrix operations, solving systems with inverse matrices, row reduction, and systems of inequalities. The six page worksheet contains twenty...
Curated OER
Solve a System of Inequalities
In this system of linear inequalities activity, students solve 5 problems with the graphing method and are given 2 examples with multiple steps to follow.
Curated OER
Polynomial Functions
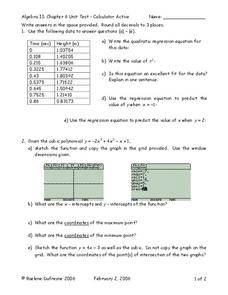
In this Algebra II worksheet, 11th graders use a graphing calculator to determine the regression equation of the given data, graph polynomial functions, factor polynomials, and determine the quotient and remainder in polynomial division....
Curated OER
Interpreting Graphs
Students investigate graphs. In this graphing lesson plan, students create a graph regarding the population of California. Students extrapolate answers concerning the data set.
Curated OER
Chronic Conics
Fourth graders use two activities to draw four different conic sections. One activity is of a physical nature and one is traditional paper and pencil.


