Curated OER
Comparing Fractions with the Same Numerators, Assessment Variation
Have your class demonstrate their ability to compare fractions with this short multiple-choice assessment. Using the fractions 9/8 and 9/4, the students first make comparisons using both words and the greater than/less than signs. Next,...
Curated OER
Taking Attendance
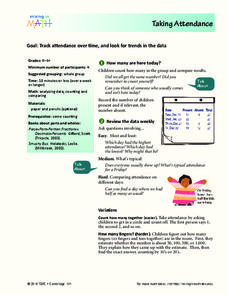
Young mathematicians record and analyze data. They will take attendance for their class and compare to other days. Then discuss ways to count who is present. They may also show the amount of students present using fractions.
EngageNY
Dilations as Transformations of the Plane
Compare and contrast the four types of transformations through constructions! Individuals are expected to construct the each of the different transformations. Although meant for a review, these examples are excellent for initial...
EngageNY
Unknown Length and Area Problems
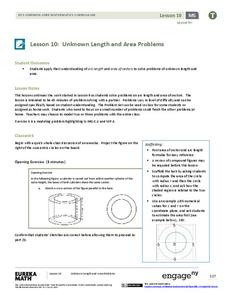
What is an annulus? Pupils first learn about how to create an annulus, then consider how to find the area of such shapes. They then complete a problem set on arc length and areas of sectors.
Illustrative Mathematics
What Shape Am I?
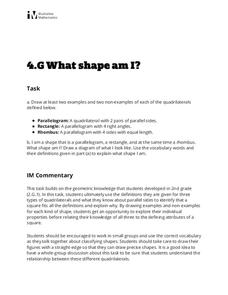
Sharpen your pencil and grab a ruler, it's time to draw some quadrilaterals! Given the definition of a parallelogram, rectangle, and rhombus, learners draw examples and nonexamples of each figure. The three definitions are...
Curated OER
Geometric Abstraction
Learners create an abstract work of art that is made by repeating geometric shapes and lines, write concise instructions to reproduce the work of art and reproduce someone else's artwork via written instructions.
Curated OER
Penny Basketball: Making Sense of Data
Explore four web-based interactive sites to develop a baseline understanding of statistics. Learners play a series of penny basketball games and collect data regarding their shooting statistics. Groups decide who is the "top" penny...
Curated OER
Can You Name That Shape?
Learners use materials to build, investigate, and draw two-dimensional shapes (polygons). They combine the shapes they have built and draw from the pile to begin a round-robin activity to name and determine the attributes of a selection...
Curated OER
Dental Detectives
First graders explore the theme of dental health and hygeine. They make tooth loss predictions, count lost teeth, and graph tooth loss. In addition, they listen to dental health stories, read online stories, create spreadsheets, and play...
Bowland
Fruit Pies
Scholars use formulas for the area of a circle and the area of a rectangle to determine the number of pies a baker can make from a particular area of dough. They must also take into account rolling the remaining dough into a new sheet.
Curated OER
The Food Guide Pyramid
Students examine each level of the food pyramid and how many servings they should consume during the day. They study the important nutrients associated with each category of the food pyramid.
Curated OER
Spoonfuls, Cupfuls and Handfuls
Explore the use of non-standard units for measuring volume with elementary learners. They fill a container and count the number used using cups, spoons, and bottles, build with blocks and count the number of blocks used, and compare and...
Curated OER
Indiana Applied Skills Assessment Sample
In this Applied Skills Assessment worksheet, 5th graders complete a sample state assessment for Language Arts and Mathematics for 5th graders. They read a writing prompt and complete a writing activity that follows, answer various types...
Curated OER
Famous Public Properties
What can a middle schooler do in 90 minutes? He can practice using the commutative, associative and distributive properties of addition and multiplication. He can also simplify expressions using the commutative, associative and...
Curated OER
Area and Perimeter Floor Plan
Using Google SketchUp, learners draw a model of their bedroom. They begin by measuring the dimensions of their bedroom, inputting this information into the software program, and calculating perimeter and area. This is an interesting and...
National Security Agency
Going Green with Graphs
In this unit designed for second graders, youngsters are introduced to conducting surveys and creating tally charts based on the data they gather. Students then construct bar graphs, and observe the relationships between the two...
National Security Agency
Starting a Restaurant
Through an engaging unit, chefs-in-training will sort and classify data using tally charts. Learners will also create bar graphs to display restaurant data and interpret data from bar graphs using a variety of categories....
Illustrative Mathematics
Converse of the Pythagorean Theorem
Use the given tasks and detailed teacher's commentary to introduce your 8th graders to the Pythagorean theorem and its converse. Embedded links to information about Egyptian geometry make your presentation interesting. Consider...
Curated OER
Explaining the equation for a circle
By first starting with an explicit example of a radius and center point, this challenging lesson tries to help students gain an understanding of the Pythagorean theorem and the equation of a circle. Once they have accomplished the first...
Curated OER
Summer Intern
Your young apprentices build a function describing the percent concentration of salt in a brine. The rational function is then related to the parent function, y= 1/x, and graphed. Finally, the apprentices predict the amount of fresh...
Georgetown University
Cup-Activity: Writing Equations From Data
Determine how cup stacking relates to linear equations. Pupils stack cups and record the heights. Using the data collected, learners develop a linear equation that models the height. The scholars then interpret the slope and the...
Curated OER
Venn Diagrams & Word Problems
Pupils explore the concept of Venn Diagrams through word problems. In this Venn Diagram lesson, students solve word problems about groups of people using Venn Diagrams. Pupils use survey results about MySpace and Facebook in a Venn...
Curated OER
Comparing Fractions 4
In this elementary math worksheet, students examine the shaded fraction models and compare them to the value given. Then they answer the 3 questions in the multiple choice format.
Curated OER
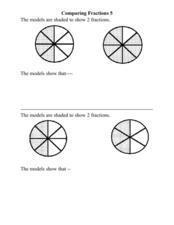
Comparing Fractions 5
In this elementary math worksheet, 4th graders compare the circle graphs expressed as fraction models in order to determine the fraction values for the four graphs.
