Curated OER
Clock Fractions
Elementary schoolers generate and manipulate fractions. They review equivalent fractions and use an analog clock to create and add fractions. Pupils work in groups to complete two fraction worksheets.
Curated OER
Comparing and Ordering Decimals - Complete Lesson Plan
Base ten blocks serve as visual representations of numbers that include decimals to the hundredths place. Children compare and order decimals in their math journal as they build the corresponding numbers with base ten blocks.
Curated OER
A Walk in the Park
Using a word problem, learners practice estimation techniques. After leading the class through a solution to this problem, a teacher could have the class complete other estimation activities using this one as a model.
Curated OER
Calculate Percentages
Sixth and seventh graders study the concept of finding the percent of a number. They calculate the percent of any given number. Pupils describe ways to use calculating percents in their daily life, and change percents into decimals,...
Curated OER
Part-Whole Mats
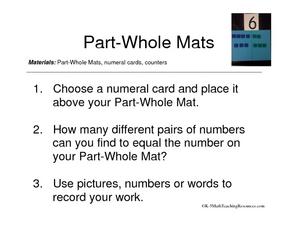
A part-whole mat is a great way to practice simple addition using math manipulatives. Learners choose a number card and place it at the top of their mat. Using counters, they record the different number pairs which would add together to...
Curated OER
Multiplying with Egg O
Third graders multiply whole numbers by one and two digit numbers using base ten blocks and Egg O multiplication game. students pass out egg cartons, counters, and a record sheet to each group.
Curated OER
Half of a Half
After your math classes have been introduced to fractions (especially those with denominators of two, four, and eight), introduce them to fractions on a number line with this lesson. Using a meter length of tape, show your class where...
Curated OER
Making Cents of Fractions and Decimals
Young scholars explore decimals and fractions using groups of 100 pennies. By classifying the pennies in different ways, there are an unlimited number of ways to learn fractions, decimals, and place value in money. This is a good,...
University of Arkansas
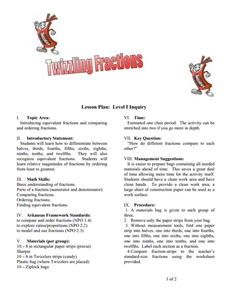
Twizzling Fractions
Using food as a manipulative is one of the best ways to incorporate hands-on learning in the classroom. This hands-on approach allows young mathematicians to compare, order, and identify fractions with the use of Twizzlers® and...
Curated OER
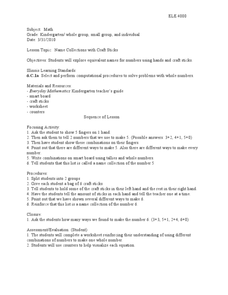
Name Collections with Craft Sticks
Groups of Kindergarten students count craft sticks in different groups and name how many they have. They complete simple addition to ten with the use of manipulatives.
Curated OER
Grab a Handful and Count
Let's use Fruit Loops to teach counting skills! Pupils practice counting one-to-one correspondence using Fruit Loops with a partner and then compare them to see who has more or less.
Curated OER
Area Applet
Elementary math classes calculate the area of a shape and explain the correlation between the size of the perimeter and the areas that can be contained within that perimeter. They also explain the effect the shape of the perimeter has on...
Utah Education Network (UEN)
Simplifying Algebraic Expressions
Sixth and seventh graders explore the concept of simplifying algebraic expressions. They review the order of operations and apply properties to simplify and compare them. The author suggests using a "Boxes Game" as a motivator to get...
Curated OER
Equivalent Fractions
If you are looking for a simple way to review equivalent fractions, this is a great resource. Using a visual means and a series of examples, learners review this skill. There is a worksheet provided and a prompt to encourage pupils to...
Curated OER
Relations
Students identify, compare, and analyze shapes and numbers. In this analogies and comparison math lesson plan, students warm up by completing 4 worksheets to familiarize themselves with analogies. In small groups, students are challenged...
Curated OER
Probability
Here is a classic activity used to introduce your class to the concept of probability and data collection. They will roll one die 30 times, then record and discuss the results. Great introduction, but too shallow to be considered a...
Curated OER
Fractions and Measurement
Using a Smart Board, or a plain ol' white board or chalkboard, the teacher pulls up a grid and demonstrates how squares and rectangles can be divided up into equal parts. The class will get their own graph paper to draw shapes and divide...
CK-12 Foundation
Fundamental Trigonometric Identities: Tangent Identity
An identity that thieves can't steal the tangent identity. Scholars manipulate ratios to investigate the tangent ratio and connect it to the sine and cosine ratios. An interactive that uses color coding helps with this task.
Curated OER
Perimeter
Students study about perimeter and the units used to measure perimeter using a variety of materials including their hands, feet, rulers, and computer applets. They understand such attributes as length, area, weight, volume, and size of...
Curated OER
Impossible Graphs
Young scholars practice plotting functions on the Cartesian coordinate plane while participating in a discussion about the Possible Or Not worksheet/activity. Students also use the Impossible Graphs worksheet to practice reading a graph,...
Curated OER
Introduction to the Concept of Probability
Middle and high schoolers have a clarified definition of probability, they explore about outcomes in probability and how to calculate experimental probability. They use computers to learn about probability.
Curated OER
Statistics and Shopping
Explore how statistics are used in everyday life. Your soon-to-be savvy consumers use the Internet to find consumer-related statistical information and learn to make wise consumer decisions. Includes links to a practice sheet about data...
Curated OER
Fire!, Probability, and Chaos
Upper elementary and middle schoolers work with the concept of probability. They are introduced to the concept of chaos. Learners graph and analyze using a line plot, work with mean, and are introduced to the concept of variance.
Curated OER
Box Plots
Young statisticians are introduced to box plots and quartiles. They use an activity and discussion with supplemental exercises to help them explore how data can be graphically represented.


