Curated OER
Frequency Distributions and Measures of Central Tendency
Twelfth graders use the Internet to research information on NFL players and construct frequency distributions from the data. They calculate the mean, medium and analyze their data.
Curated OER
Geo-Mat
Students review plane figures by playing a game that resembles "Twister." They listen to directions to locate a large example of the figure which is placed on the floor.
Curated OER
Folding Fractions
Students create a set of fraction circles using a paper folding technique. They fold 10 inch circles of paper into the indicated fractions, identify the fractions, and use them to show equivalency.
Curated OER
Why Do We Add The Bases To Find The Area of A Trapezoid?
Students are given patterns of trapezoids and are to calculate the area of one trapezoid by using both patterns. They should form a parallelogram and calculate the area. They practice this technique until there is understanding.
Curated OER
Following Specs.
Students utilyze a set number of DUPLO blocks to build a free-form construction project.
Curated OER
Thinking Like An Engineer
Students explore physics. They investigate the strategies used by an engineer to solve a problem. Students construct various models to solve the problem. They display their solutions and explain how they solved the problem.
Curated OER
Money as a Means of Exchange
First graders discover the term bartering as used to pay for wanted items. They play a bartering game to discover exchanging goods for wanted items and play the computer money game on the "Show-Me Economics" web site.
Curated OER
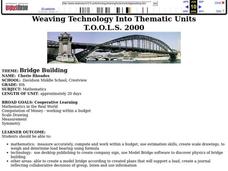
Bridge Building
Eighth graders will create model drawings of bridges and integrate technology into the process of creating a visual representation. Technology is used in the industry of design and architecture. This lesson helps to build real life skills.
Curated OER
Get In Line!
Learners compare and order fractions and decimals using a number line. They use rules of conversion to determine equivalencies competing problems accurately and plot points on the number line that represent the correct order of the...
Curated OER
Indiana State Testing Review
In this literacy set of worksheets, 3rd graders practice getting ready for the state test. They have a writing and mathematics portion to complete for ISTEP preparation with the 3rd grade standards.
Curated OER
Clownin' Around
In this estimation worksheet, students read about a girl, Amy, who is purchasing items for a class play. Students determine whether Amy needs to find an exact answer or an estimate for the things she is buying. There are 6 questions on...
Curated OER
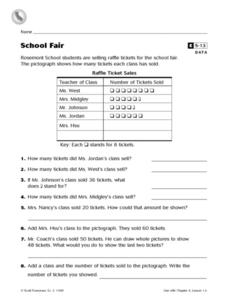
School Fair
For this data worksheet, students look over a table containing data collected from selling raffle tickets and then answer 8 short answer questions relating to the table.
Curated OER
Meanings of Addition
In this beginning addition worksheet, students read the information and examples that demonstrate that addition means putting together groups. Students then solve 2 addition problems.
Curated OER
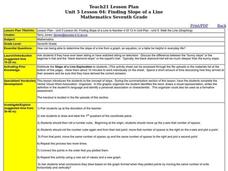
Finding Slope of a Line
Students calculate the slope of a line. In this algebra lesson plan, students graph a line using the slope and y-intercepts. They define the steepness of the line using the slope.
Curated OER
Graphing Linear Equations
Learners graph linear equations. In this algebra lesson, students solve linear equations and graph it on a coordinate plane. They evaluate integers using linear equations.
Curated OER
Graphing Linear Equations with Calculator
Students graph lines using the calculator. In this algebra instructional activity, students graph lines of equations in the form y=mx+b. They input equations into the TI Calculator and graph using the slope and intercept. They analyze...
Curated OER
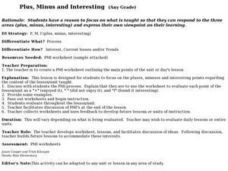
Plus, Minus and Interesting
Students identify the main ideas or topics of a lesson plan or unit using the plus, minus and interesting graphic organizer. In this main idea or topic lesson plan, students examine the use of the PMI graphic organizer. They describe the...
Curated OER
Hot Dog Stand: The Works
Students strengthen skills in mathematics, problem solving, and communication skills by working together in groups using "Hot Dog Stand: The Works" educational software.
Curated OER
Dot To Dot: Making a Dragon
Students draw a dragon as they connect the dots. In this counting skills lesson, students count from 1-37 to complete a connect the dots puzzle and then discuss the Chinese New Year.
Curated OER
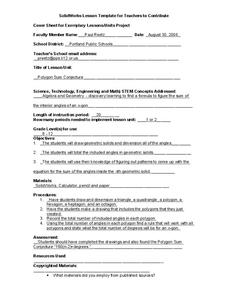
Polygon Sum Conjecture
Students calculate the sum of the angles of a polygon. In this geometry lesson plan, students use the interior angle formula of polygon based on the number of sides of the polygon. They identify the missing angle using algebra.
Curated OER
Curve Fitting and the TI-85 Calculator
Seventh graders follow a step-by-step guide for using graphing calculator to determine equations which best fit data graphed. They gather data from various sites on the web, or they do searches to find information necessary to complete...
Curated OER
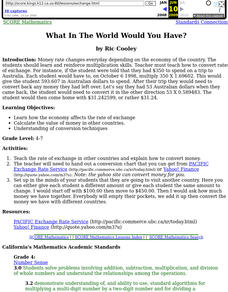
What In The World Would You Have?
Students calculate value of money in other countries, and explore how the economy affects the rate of exchange.
Curated OER
Caldecott Medal Winners
Second graders identify Caldecott Medal winners. In this library media lesson, 2nd graders view an overhead transparency of Caldecott Medal winners from 1987-2004 and answer questions based on the data that is displayed.
Curated OER
What Temperature Is It?
Pupils use the internet to research information on the average maximum and minimum temperature for a city in their state. They create spreadsheets and enter data to analyze the information, focusing on averages, maximums, minimums and...


