Curated OER
Managing Nutrients in Livestock Manure
Livestock managers reinforce math and science skills while learning about the nutrients found in manure. They predict which animal produces the largest amount and which animal's manure contains the most nitrogen. Finally, they compare...
Curated OER
Strength in Size? Madagascar Cockroach Pulls
Fourth graders conduct an experiment involving size and relative ability in smaller species using Madagascar cockroaches. They make predictions about how many pennies the roaches can pull, compare the results to human strength, and...
Pennsylvania Department of Education
Equally Likely and Unequally Likely Outcomes
Learners explore probability. In this statistics/probability lesson, students compare experimental and theoretical probability and use experimental probability to make predictions and conjectures. Learners explore the...
Curated OER
Follow the Pattern
Learners survey patterns and relationships and then predict outcomes in real-world situations.
Curated OER
Temperature and Pressure on Airplane Surfaces
Learners use the Internet to delve into the relationship between fores and motion on a sizable object. They predict where they think the temperature and pressure be the greatest, and where the pressure be the lowest.
Curated OER
Science and Technology
Students research inventions that have been created. In this historical technology lesson, students read the Harcourt Brace social studies textbook and discuss how inventors used graphs to display data. Students create a table to write...
Curated OER
Cyber Combos
Students use lists and tree diagrams to identify possible combinations of objects. They systematically list all possible choices, and predict the number of outcomes using multiplication.
Curated OER
Alternative Energy Part II - Lesson Eight of Eight - Energy Conversion and Propulsion
Students investigate the results of different propulsion methods. In this propulsion instructional activity, students measure the distance a test toy car goes using different types of propulsion. They record the distances in data tables...
Curated OER
You Drive Me crazy
Students calculate the distance and acceleration of an object. In this algebra instructional activity, students collect data and create table and graphs to analyze it. They complete a lab as they collect and analyze data on acceleration...
Curated OER
Mr. Cobbler's Shoe Dilemma
Students employ statistics to solve real-world problems. They collect, organize and describe data. They make inferences based on data analysis. They construct, read, and interpret tables, charts and graphs.
Curated OER
Smarties Investigation
In this math worksheet, students complete a variety of activities using Smarties candy. For example, students estimate the number of each color, count the actual amount, and record their results in a tally chart.
Curated OER
Skittles, Taste the Rainbow
Fifth graders learn and then demonstrate their knowledge of a bar and a circle graph using the classroom data. Students are given a pack of skittles candy. Students create a bar and circle graph indicating the results of the contents of...
Curated OER
Graphs Galore
Fourth graders conduct surveys to collect data. They analyze and interpret the data, then determine which type of graph is appropriate for the data. Students use the data to make predictions, discover patterns and draw conclusions...
Curated OER
Tile Patterns that Grow
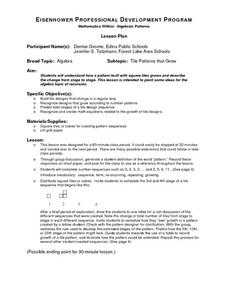
Students explore how a pattern built with square tiles grows and describe the change from stage to stage. They predict later stages of a tile design sequence and create math equations related to the growth of tile designs.
Curated OER
Double, Double: Looking at the Effect of Change on Perimeter, Area and Volume
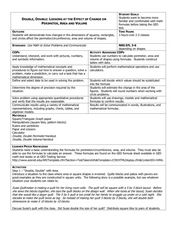
Students explore perimeter, volume, and area. In this math instructional activity, students explore how changes in dimensions of geometric shapes affect the perimeter, area and volume of the various shapes. Students investigate the...
Curated OER
Cuisenaire Fractions
Young scholars study fractions by comparing rations using Cuisenaire rods. They make predictions, measure lengths using Cuisenaire rods and explain their answers. Next, they discuss the relationship of the different rods in terms of...
Curated OER
Trouble in the Troposphere
Students Use data sets from MY NASA DATA to produce graphs comparing monthly and yearly ozone averages of several U.S. cities. They analyze and evaluate the data and predict trends based on the data. In addition, they discuss and...
Curated OER
What are the Odds
Students predict the-outcome of an event. In this algebra lesson, students compare and contrast the probability of an event occurring. They calculate the odds of a simple event and make estimation.
Curated OER
Drip, Drip, Drip or The Case of the Leaky Faucet
Students explore the cost of wasted water. In this math lesson plan, students conduct an experiment in which they collect data on how much water is lost when a faucet leaks. Students figure the cost of the water that was wasted.
Curated OER
The Stock Market Game
Students explore the stock market. They choose a company and research the company's financial report. Students select 4-10 stocks and become an advocate for one stock. Using spreadsheet software, students compare stocks. They analyze...
Curated OER
Childhood Obesity
Students identify a question to generate appropriate data and predict results. They distinguish between a total population and a sample and use a variety of methods to collect and record data. Students create classifications and ranges...
Curated OER
The Human Line Plot
Fifth graders collect data and use charts and line plots to graph data. Through class surveys, 5th graders collect data concerning a particular subject. They graph their data using a line graph. Students make inferences and predictions...
Curated OER
Data Representation
Students solve real life scenarios using math. In this geometry instructional activity, students collect, predict and interpret data. They measure a chair using different measurements and choose what would make the chair the best design.
Curated OER
Possible Outcomes 7
In this math worksheet, 6th graders make predictions about the possible outcomes for two word problems and correlate the data found in the graphic organizer.


