Virginia Department of Education
Line of Best Fit
Pupils work through a guided activity on fitting a linear equation to a set of data by entering the data into a calculator and trying to envision a line of best fit. They then have the calculator determine the least-squares line and...
Curated OER
Counting Crows
Students discuss the fable, The Crow and the Pitcher. In this literature instructional activity, students read the fable and create a crow sock puppet. Students use their puppets to dramatize the fable.
Curated OER
Counting the Stars in Draco
In this counting stars instructional activity, students construct a histogram for stars in a given star field using their apparent magnitude. Students answer 5 questions using their tabulated data and histogram to answer questions about...
Mathematics Vision Project
Quadratic Equations
Through a variety of physical and theoretical situations, learners are led through the development of some of the deepest concepts in high school mathematics. Complex numbers, the fundamental theorem of algebra and rational exponents...
Curated OER
Bungee M&M's
Science is exciting - and delicious! Pairs of learners set up a bungee cord type of experiment. They use buckets filled with M & M's, a meter stick, and a Slinky spring (as the bungee) to conduct their experiment. A good activity...
Curated OER
Discovering Pi/Welcome to Pi Day
Students explore pi. In this circle measurement lesson, students define and identify radius, diameter, circumference, and perimeter. Students work in groups to measure several plastic lids and record their findings. Students compare the...
Curated OER
Ornithology and Real World Science
Double click that mouse because you just found an amazing lesson plan! This cross-curricular Ornithology lesson plan incorporates literature, writing, reading informational text, data collection, scientific inquiry, Internet research,...
Curated OER
Monster Data
An inventive instructional activity shows learners how to collect, organize, and present mathematical data. They access websites which lead them through a variety of ways to engage in data collection. They get to design and create...
Curated OER
Be Sharp and Never Flat
An outstanding lesson on music awaits your young composers! They learn about patterns found in music, the different sections of an orchestra, and see the differences between musicians and a composer. Excellent streamed videos and good...
Curated OER
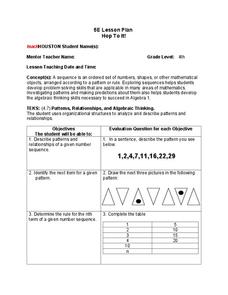
Hop To It!
Students determine patterns. In this mathematics lesson, students act out a skit, play a sequence game, and complete patterns. Students use problems solving skills.
Western Kentucky University
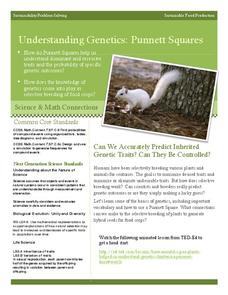
Understanding Genetics: Punnett Squares
Can scientists really predict genetic outcomes or are they simply making a lucky guess? Scholars first learn about Gregor Mendel and how to make Punnett squares. Then they extract DNA from a strawberry in a lab with included conclusion...
Curated OER
Physical Science: Festival of Bubbles
Investigate bubbles through the use of scientific inquiry. Pupils blow bubbles using several methods and measure the resulting bubble print. Measurements are recorded on a data table and transferred to a bar graph. Results are discussed...
Curated OER
Volume, Mass, and Weight
Study the difference between mass and weight. Your math group will compare the weight of an item to the amount of space that it uses. They'll then use conversion factors to find the difference between kilograms and pounds. Essential...
Beyond Benign
Green"er" Precipitation Reaction
All sodium carbonate may not have the same amount of carbonate, but it should have the same percent. Learners write and balance an equation to predict the chemical reaction between sodium carbonate and zinc acetate. Through the lab...
Curated OER
Ohio Census 1990 & 2000
Students use Ohio census data to solve problems, make comparisons, draw conclusions, and support predictions related to Ohio's population. They interpret and work with pictures, numbers and symbolic information.
Curated OER
Counting Squares
In this counting squares worksheet, students solve 2 problems that include counting 2 different sets of squares. First, they draw a picture of four squares arranged in two rows of two. Then, students determine the total number of squares...
Curated OER
Integration: Statistics, Scatter Plots and Best-Fit Lines
In this math worksheet, students identify the type (if any) of correlation on 6 scatter plots. They use information given on a table to create a scatter plot and identify the type of correlation. Students use the scatter plot to make...
Curated OER
Using Coordinate Geometry by Land, Sea and Outer Space.
Students complete a table of values and plot points, as well as construct a graph on a coordinate grid. They construct two graphs on the same coordinate system, and identify the point of intersection. Students represent and record...
Curated OER
Create and Analyze Rectangular Patterns
Students explore the concept of geometric patterns. In this geometric pattern lesson, students use Microsoft Excel to explore geometric patterns. Students analyze growth rates of pattern growth. Students create their own patterns and...
Curated OER
Linear Patterns in Data
Eighth graders extend their learning of graphing linear equations and are introduced to connecting patterns in tables and graphs to represent algebraic representations. They then determine patterns and extrapolate information from these...
Curated OER
Creating Line Graphs
High schoolers draw line graphs. In this math lesson, students interpret minimum wage data and graph the data in a line graph. High schoolers predict the next minimum wage and figure the earnings for a 40 hour work week for someone...
Curated OER
Chew on This
Eighth graders explore and demonstrate the seven steps of the scientific method. They predict how much sugar is in chewing gum and test, analyze, and calculate the sugar content of gum.
Curated OER
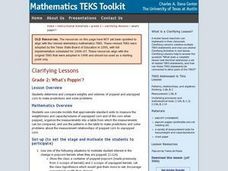
What's Poppin'?
Second graders determine and compare weights and volumes of popped and unpopped corn to make predictions and solve problems. Students combine the data of each group into a graph. They construct questions, statements and story problems...
Curated OER
Calculating Buttons
Students, after reading "The Button Box" by Margarette S. Reid, analyze real-world data by surveying a sample space. They predict the generalization onto a larger population utilizing calculators and computers. Students total categories,...


