Santa Barbara City College
How to Make a Multiplication Table
Teach children how to make a multiplication table, and they'll be multiplying for life. Following this series of steps, young mathematicians learn to use patterns and the relationships between numbers to create...
Charleston School District
Tables of Linear Functions
Don't forget the tables! The previous lessons in this five-part series examined the linear equation and graph relationship. The current lesson adds tables to the mix. At completion, individuals should be able to create a table of values,...
Soft Schools
Multiplication Table
Use the multiplication table as an aid for young mathematicians who are learning their multiplication facts. Children can explore the concept of multiplication by using the factors in the far left column and the top row to determine a...
Math Worksheets Land
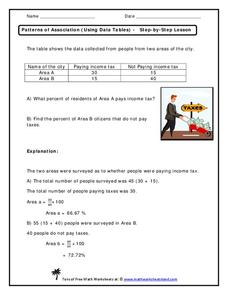
Patterns of Association (Using Data Tables) - Step-by-Step Lesson
This worksheet belongs to a four-part resource that gathers information from data tables to calculate percentages. The page introduces one problem and shares an explanation to the answer.
Willow Tree
Linear Relationships
There's just something special about lines in algebra. Introduce your classes to linear equations by analyzing the linear relationship. Young mathematicians use input/output pairs to determine the slope and the slope-intercept formula to...
Willow Tree
Interior Angles, Exterior Angles, and Diagonals of Polygons
How does the number of sides of a polygon affect the angle measures? Learners recognize a pattern in finding the total measure of interior and exterior angles and the number of diagonals. They use the patterns to calculate...
Willow Tree
Direct and Inverse Variations
Enhance pupil understanding of proportions and variable relationships by studying direct and inverse variation. Use the idea of a proportional relationship to teach direct variation. Then use a similar pattern to help individuals...
San Jose Unified School District
Multiplication Chart
Looking to support your young mathematicians with mastering their multiplication facts? Then this set of multiplication charts is a great place to start, allowing children to visualize the the relationships between factors and multiples.
West Contra Costa Unified School District
Discovering Zero and Negative Exponents
Need a hand with an Algebra II integer exponent lesson? This versatile worksheet can be utilized as a lesson to supplement instruction. It derives the idea of a negative exponent before practicing a variety of questions.
Willow Tree
Scatterplots and Stem-and-Leaf Plots
Is there a correlation between the number of cats you own and your age? Use a scatter plot to analyze these correlation questions. Learners plot data and look for positive, negative, or no correlation, then create stem-and-leaf plots to...
Code.org
Making Data Visualizations
Relax ... now visualize the data. Introduce pupils to creating charts from a single data set. Using chart tools included in spreadsheet programs class members create data visualizations that display data. The...


