Curated OER
Maximize It!
Students design a rectangular box without a lid that has the largest possible volume using the supplied sheet of centimeter graph paper. They work in groups to construct different size boxes to determine the largest possible volume and...
Curated OER
A Special Relationship
Learners discover the relationships of the lengths of the sides of right triangles and right triangles using a series of drawings on dot paper. They investigate and solve problems of standard (customary and metric units) and non-standard...
Curated OER
Learning Number Words
Students practice saying their numbers and identifying the words. They use whole numbers and decimals to practice grouping numbers into different categories. They write the word of the number they are shown.
DK Publishing
Big, Bigger, Biggest
Which water creature is the biggest? Youngsters look at an image of a big shell, then draw a bigger shell next to it. They do the same for a big fish. Next, learners practice with the superlative as they circle the biggest duck and frog....
Curated OER
Functions and Their Graphs
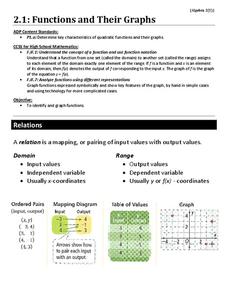
Use a worksheet to go over the basic concepts of relations and functions. Included are clear definitions and examples of relations, domain and range, and functions and the vertical line test. However, the problems are pretty...
Cornell University
Hydrophobic Surfaces—Deposition and Analysis
Couches, carpets, and even computer keyboards now advertise they are spill-resistant, but what does that mean? Scholars use physical and chemical methods to coat surfaces with thin films to test their hydrophobic properties. Then they...
Curated OER
Atlatl Lessons
Fifth graders study math patterns and relationships as well as learn about the heritage of Aboriginal peoples of Saskatchewan. In this patterns and heritage lesson, 5th graders research the daily lives of First Nations People in...
Curated OER
Virtual Field Trip
Students calculate gasoline cost per mile on a virtual field trip. They calculate the gasoline costs and travel time for each of the 2 routes, and record on a data sheet. They use Excel to create data tables for mileage, gasoline...
Curated OER
Using Representations to Model Problems
student make predictions or draw conclusions based on physical and visual representations of profit and sales. They model problems with physical materials and visual representations, and use models, graphs and tables to draw conclusions...
Curated OER
The Truth About Triangles and Squares
Fourth graders investigate the patterns associated with both triangular and square numbers. They use counters as manipulatives to depict the numbers as needed but focus on problem solving using mental math techniques.
Curated OER
Toothpick squares
Students state the general rule for a practical situation. They describe a continuing pattern. They use toothpicks to help visualize the problem and answer it correctly.
Curated OER
Paper Pool
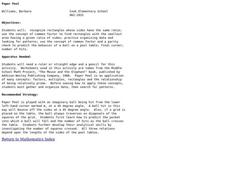
Learners analyze the measurements of rectangles. In this analysis lesson, students will investigate patterns by looking at ratios. Learners will also hypothesize the probability of a ball going into a certain pocket when playing pool....
Curated OER
Sunrise/Sunset
Students apply data from a weather-related website to predict patterns in the sunrise and sunset.
Curated OER
Supermarket Displays
Second graders look at the number patterns created when cans are stacked in different arrangements. The aim of the unit is for students to keep track of the numbers involved by drawing up a table of values. They are then encouraged to...
Curated OER
Rows of Numbers
Students generate patterns from a structured situation, find a rule for the general term, and express it in words and symbols. They also devise and use problem solving strategies in a systematic way.
Curated OER
Where Do Fish Live in the Hudson?
Students explore the environmental factors that influence where fish live and determine the makeup of fish communities in the Hudson. They interpret guided observations and measurements to assess patterns, sequences and relationships.
Curated OER
Poppy Meets Pythagoras
Eighth graders find connections between numbers in a table; use Pythagoras' theorem in a general algebraic form; and measure accurately from a scale drawing to find a method that might enable the helicopter to land inside a rectangular...
Curated OER
Jackson's Consecutive Numbers
Students generate patterns from a structured problem, finding a rule for the general term, and expresses it in words and symbols. They then devise and use problem solving strategies to explore situations mathematically.
Curated OER
Square Milk Bottle Crates
Students attempt a problem that Students has the potential to have more than one solution. Hence the problem is accessible to a wide range of students. The problem is essentially about finding patterns and this is typical of a number of...
Curated OER
Fish Communities in the Hudson
Students use tables of fish collection data to draw conclusions about where fish live in the Hudson Estuary. Given available data they interpret organized observations and measurements and recognize simple patterns, sequences, and...
Curated OER
Graphs
Students graph ordered pairs to model the relationship between numbers. After observing the patterns in ordered pairs, they describe the relationship, and create graphs from a data table. Students describe intervals in the graph, and...
Curated OER
Counting By 5s
Second graders count by 5's to 100. In this math lesson conducted on the 100th day of school, 2nd graders use picture stamps in the KidPix program to count by 5's and get to 100.
Curated OER
the Squares of Numbers in Multiplication
Students memorize the multiplication math facts and learn many different ways of visualizing and practicing the multiplication concepts. They begin practicing with arrays, skip counting, and moving manipulatives for the 0, 1, 2, 3, and 4.
Curated OER
Speed + Graphing = Winners!
Fifth graders take addition timed tests every day for a two week period. Using the data from the timed tests, they create a bar graph using Microsoft Excel computer software, a personal bar graph using graph paper and colored pencils,...


