Curated OER
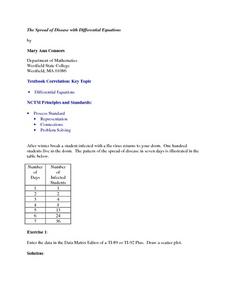
The Spread of Disease with Differential Equations
Twelfth graders solve problems using differential equations. In this Calculus lesson, 12th graders analyze data regarding the spread of a flu virus. Students use the symbolic capacity of the TI-89 to develop a model and...
Curated OER
Tall Tale Rollers
Learners explore American tall tales. In this tall tale lesson, students discover the six characteristics that are included in tall tales. Learners survey their class to find each student's favorite tall tale character and organize the...
Curated OER
Number Chart 11: Skip Counting By 4
In this skip counting learning exercise, students fill in the missing numbers to complete the pattern. Students start with the number 4 and skip count up to 160. There are some clues provided.
Curated OER
Number Chart 13: Skip Counting by 9
In this skip counting worksheet, 4th graders fill in the numbers to complete a pattern of skip counting by 9. Students begin with the number 5 and write the numbers as they skip count to 500.
Curated OER
Number Chart 16: Skip Counting By 7
In this skip counting worksheet, students fill in the numbers to complete a pattern of skip counting by 7. Students begin with the number 7 and write the numbers as they skip count to 300.
Curated OER
Products, Multiples, Factors
In this products, multiples, and factors worksheet, students complete various activities where they solve problems for products, multiples, and factors of numbers. Students complete 14 problems.
Curated OER
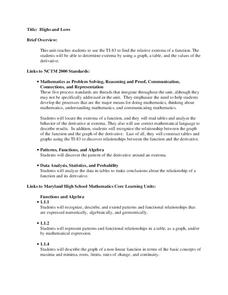
Highs and Lows
Solve problems using integration and derivatives. By using calculus, learners will analyze graphs to find the extrema and change in behavior. They then will identify the end behavior using the derivatives. Activities and handouts are...
Curated OER
Virtual Field Trip
This hands-on resource has future trip planners analyze graphs of mileage, gasoline costs, and travel time on different routes. While this was originally designed for a problem-solving exercise using a Michigan map, it could be used as a...
Curated OER
Interpreting and Displaying Sets of Data
Learners explore the concept of interpreting data. In this interpreting data lesson, students make a line plot of themselves according to the number of cubes they can hold in their hand. Learners create their own data to graph and...
Curated OER
Maps and Modes, Finding a Mean Home on the Range
Fifth graders investigate data from maps to solve problems. In this data instructional activity, 5th graders study maps and collect data from each map. Students present their data in a variety of ways and calculate the mode, mean,...
Curated OER
Understanding 10: Backwards and Forwards
Help your young mathematicians completely master 10 by practicing one-to-one correspondence, number recognition, and recording numbers displayed. They make 10 with groups of two-different colored cubes and color in 10-frames to show how...
Curated OER
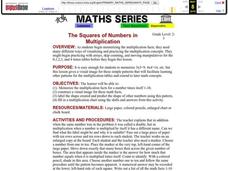
The Squares of Numbers in Multiplication
Review multiplication facts and concepts! This clear, and easy to follow instructional activity will help your class to understand multiplication by using arrays and repeated addition. There are strategies to help with memorization and...
Curated OER
Box Plots
Young statisticians are introduced to box plots and quartiles. They use an activity and discussion with supplemental exercises to help them explore how data can be graphically represented.
Curated OER
Exploring Exponential Growth and Decay Functions
Learners differentiate between exponential growth and decay. In this algebra instructional activity, students solve exponential equations using properties of exponents. They use the Ti calculator to graph and analyze their...
Curated OER
Choose The Appropriate Graph
Fifth graders work in groups to investigate the proper use of a graph during a schoolyard ecology project. The challenge of the project is for students to choose the proper form of a graph. They gather data and conduct analysis with the...
Curated OER
Arranging Numbers from 1 to 5
Kindergarteners arrange manipulatives or everyday objects in groups of one through five. They identify groups seen in pictures of nature and compare same numbers of different objects.
Curated OER
Introduction to Statistics: Mean, Median, and Mode
Learners explore the concepts of mean, median, and mode. They develop an understanding and familiarity with these concepts. Students explore mean and median in an efficient way. Learners explore three different measures of center.
Curated OER
Fire!, Probability, and Chaos
Upper elementary and middle schoolers work with the concept of probability. They are introduced to the concept of chaos. Learners graph and analyze using a line plot, work with mean, and are introduced to the concept of variance.
Curated OER
How Alike Are We?
Fourth graders find the range, mode, median, and mean for each of the data sets (height and shoe size). They discuss which measure of central tendency for each data set best represents the class and why. Students graph the shoe size and...
Curated OER
Play It
There are a number of activities here that look at representing data in different ways. One activity, has young data analysts conduct a class survey regarding a new radio station, summarize a data set, and use central tendencies to...
Curated OER
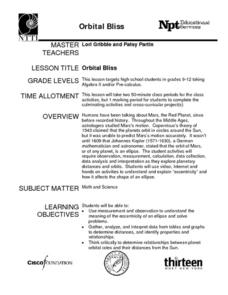
Orbital Bliss
Most young mathematicians are aware that the planets don’t orbit the sun in a circle but rather as an ellipse, but have never studied this interesting feature. This resource looks at the planetary orbits in more detail and helps learners...
Curated OER
Fire Wars
Your class can practice collecting and analyzing data. They extrapolate information and derive data from fire season statistics. They also choose the most appropriate format to display collected data.
Curated OER
Impossible Graphs
Young scholars practice plotting functions on the Cartesian coordinate plane while participating in a discussion about the Possible Or Not worksheet/activity. Students also use the Impossible Graphs worksheet to practice reading a graph,...
