Curated OER
Graphing Linear Functions
In this linear functions activity, students graph 3 linear functions. Students graph each function by making a table of values given a linear function in standard form.
Ontrack Media
Chart of Parent Functions
The characteristics of parent function vary from graph to graph. Let learners decipher the graph, table of values, equations, and any characteristics of those function families to use as a guide. The nicely organized page...
University of North Texas
Math Exam 1 Review
Perfect as a review guide, this learning exercise provides a range of questions focusing on functions. Topics include composing functions, transformations, domains, and polynomials. Also included are corresponding worksheets focusing on...
Curated OER
Functions As Graphs Worksheet
For this math worksheet, learners graph the data given in the organizer. The functions are used to create the new line for finding the possible unknowns.
Curated OER
Read the Table Graph
In this reading the table graph worksheet, students read the graph and answer questions. In this short answer worksheet, students write answers to four questions.
Curated OER
Frequency, Histograms, Bar Graphs
In this statistics learning exercise, students plot and graph their data, then interpret the data using the correct form of graphs. There are 3 detailed questions with an answer key.
Curated OER
Tables Grids
For this multiplication worksheet, learners learn how to fill out a multiplication table or grid. They then fill one out on their own with 36 blank spaces. The answers are on the last page.
Charleston School District
Review Unit 3: Functions
Time to show what you know about functions! The review concludes a series of nine lessons on the basics of functions. The problems included are modeled from the previous lessons. Pupils determine if a table represents a function,...
EngageNY
Linear Equations in Two Variables
Create tables of solutions of linear equations. A lesson has pupils determine solutions for two-variable equations using tables. The class members graph the points on a coordinate graph.
Curated OER
The Cartesian Plane
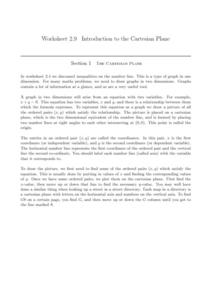
Learners solve and complete 22 various types of problems. First, they find the gradients of the lines and plot the given points. Then, they complete the table of values for each equation and use the table to draw the graph.
Curated OER
Linear Programming
In this linear programming worksheet, students solve and complete 6 different word problems related to programming. First, they define the variables in each problem and write a system of inequalities. Then, students graph the...
Charleston School District
Review Unit 4: Linear Functions
It's time to show what they know! An assessment review concludes a five-part series about linear functions. It covers all concepts featured throughout the unit, including linear equations, graphs, tables, and problem solving.
Inside Mathematics
Population
Population density, it is not all that it is plotted to be. Pupils analyze a scatter plot of population versus area for some of the states in the US. The class members respond to eight questions about the graph, specific points and...
Charleston School District
Pre-Test Unit 4: Linear Funcitons
Let your classes show you what they know! Use this pre-test to assess the current knowledge of your learners. The assessment includes all pre-algebra concepts related to functions: writing and graphing linear relationships, comparing...
Virginia Department of Education
Rational Functions: Intercepts, Asymptotes, and Discontinuity
Discover different patterns by making connections between a rational function and its graph. An engaging instructional activity asks scholars to explore the behavior of different rational functions. Groups discover a connection...
Virginia Department of Education
Quadratic Modeling
Use a one-stop resource for everything you'd possibly want to teach about quadratic functions and models. Scholars analyze key features of quadratic functions as well as transformations of functions through seven activities....
Curated OER
Math Regents Exam Questions - Pearson Integrated Algebra P.304: Histograms
In this histograms learning exercise, students solve 9 short answer, multiple choice, and graphing problems. Students construct frequency tables and histograms of data.
Curated OER
Frequency Tables; Discrete Ungrouped Data
In this frequency tables worksheet, students utilize given data to work out three frequency charts with one containing values and a pie chart involving angles for each value. Students complete three vertical line diagrams and check all...
Curated OER
Frequency Histograms, Bar Graphs and Tables
In this statistics worksheet, students graph their data using frequency histograms, bar graphs and tables. They decide which graph shows the data best. There are 6 graphing problems.
Math Mammoth
Bar Graphs 1
In this bar graph activity, students organize data in a frequency table, then create a bar graph. They find the average of the data. This one-page activity contains two multi-step problems.
Curated OER
Analyzing Graphs
In this statistics and probability worksheet, students analyze frequency distribution tables or histograms and box and whisker plots. The two page worksheet contains four multiple choice questions. Answers are included.
Curated OER
Interpreting a bar chart
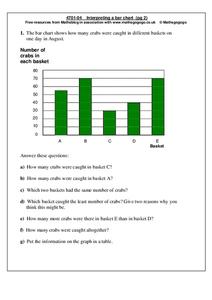
In this bar chart worksheet, students analyze a bar chart and answer 7 questions pertaining to the information on the chart. The answers are on the second page.
Curated OER
Graphing Data
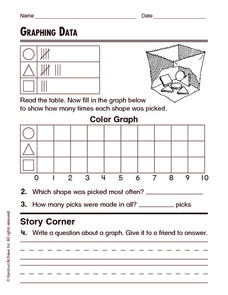
In this graphing data worksheet, students solve and complete 8 different word problems related to graphing data given. First, they determine the percent of people who do not believe in any of the phenomena described and explain. Then,...
Curated OER
Tables and Linear Graphs
In this tables and linear graphs activity, students examine linear functions. They solve equations and graph them on a coordinate plane. This four-page activity contains 8 multi-step problems. Answers are provided on...


